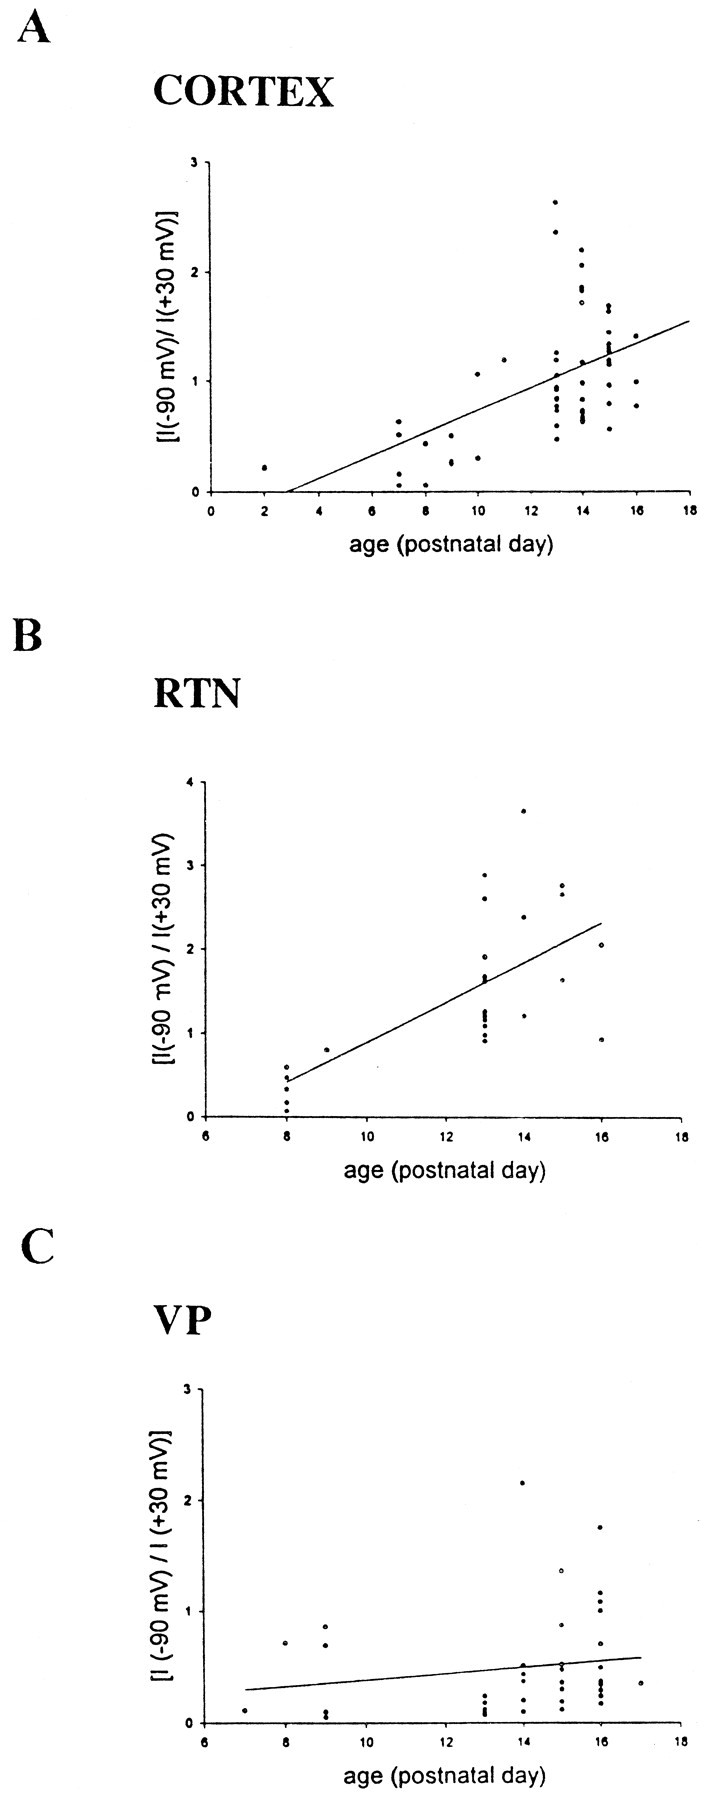
Fig. 4.

Scatter plot and linear regression analysis of the ratio of the peak burst current recorded at −90 mV to the peak burst current recorded at +30 mV versus developmental stage in layer VI (A), RTN (B), and VP (C) neurons. Note the increase in the ratio of the current at later developmental stages in layer VI and RTN neurons confirming that current–voltage relationships show voltage dependence at early stages but little or no voltage dependence at later developmental stages. In VP neurons, a large proportion of the neurons still show strong voltage dependence at later developmental stages.
