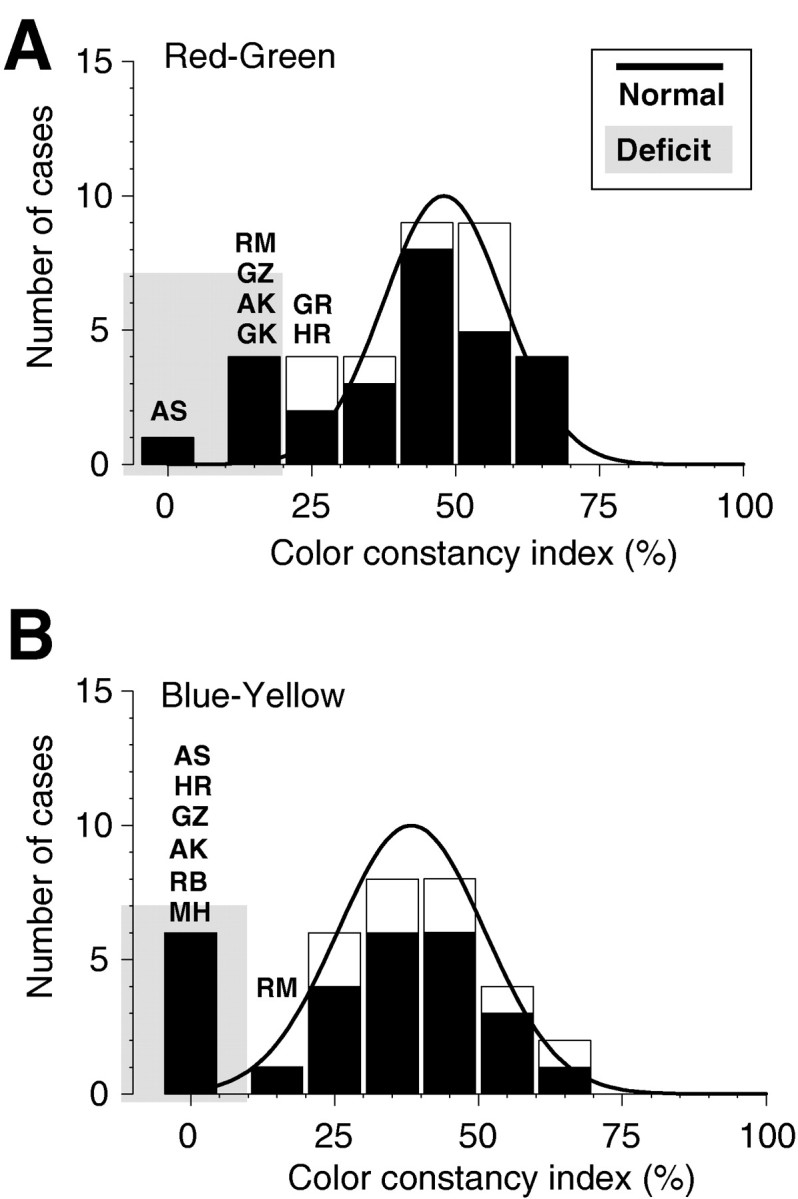
Fig. 4.

Histograms of the color constancy results of 27 patients and 8 control subjects. The ordinate gives the number of cases as a function of the color constancy indices in percent for neutral gray settings along both cardinal color directions. An index value of 0 indicates a setting of the gray rectangle irrespective of the change in illuminant (no color constancy); an index value of 100 indicates perfect adjustment to the illuminant (absolute color constancy). For comparison, the black line shows the distribution of settings for all unimpaired observers, including the control subjects; significant deviations of >2.28 SD are indicated by the shaded area. A, Color constancy indices for neutral gray settings along the red–green axis. The average of settings in both directions, toward red and toward green, is plotted. In this task, the five patients, AK, AS, GZ, RM, and GK, matched the gray value outside the statistically normal range. Patients HR and GR were just barely within the normal range. B, Color constancy indices for neutral gray settings along the blue–yellow axis. The average of settings in both directions along the blue–yellow axis is plotted. In this task, the six patients, AK, AS, HR, GZ, RB, and MH, matched the gray value outside the statistically normal range. The match of patient RM was just barely within the normal range.
