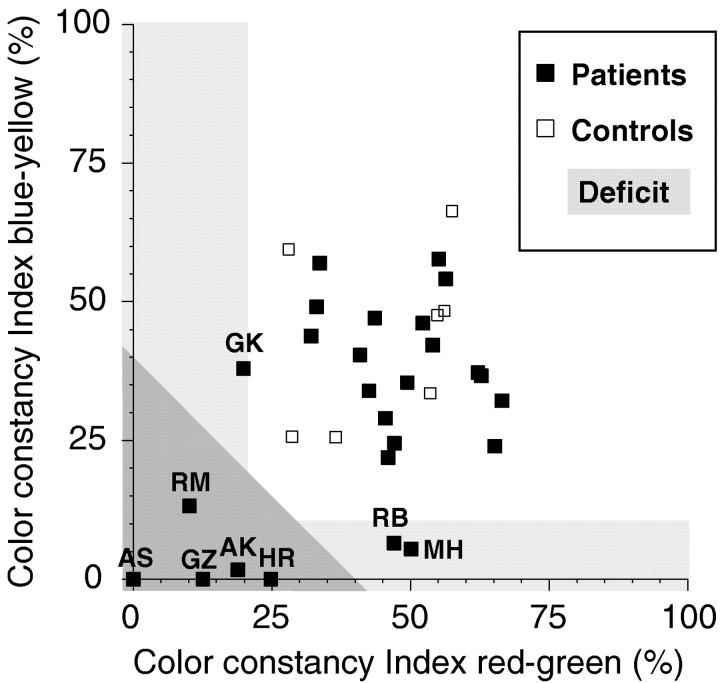
Fig. 5.
Scatterplot of the color constancy indices from Figure 4 along the red–green and blue–yellow color axes. Theshaded area indicates the range of average color constancy impairment. Slightly negative matches have been set to a value of zero. The five patients showing color constancy deficits along both color axes are AK, AS, HR, GZ, and RM. The other patients with deficits along only one color axis (GK, RB, and MH) showed normal performance along the other color axis, so that their average performance fell within the normal range.

