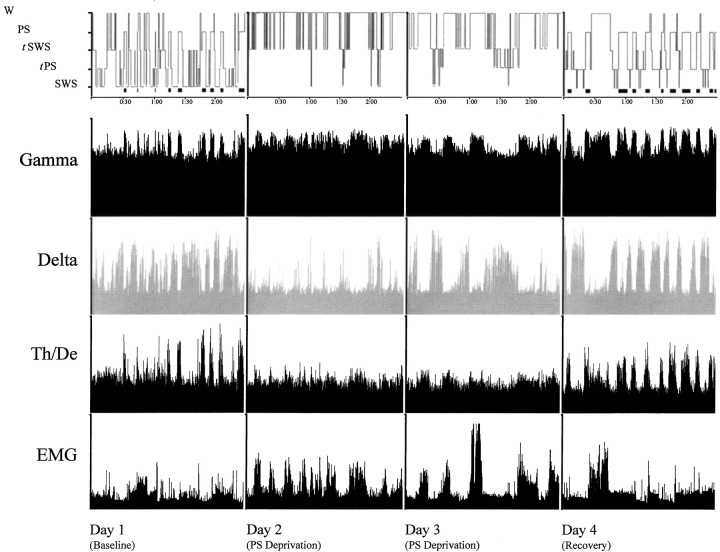
Fig. 4.
Hypnogram showing sleep–wake states (top row, with PS also indicated by black barsunderneath; scored per 20 sec epoch during the 3 hr recording period) over the four experimental days in one representative animal of the PSR condition. Activity in the gamma (30.5–58.0 Hz) and delta (1.5–4.0 Hz) frequency bands and the ratio of theta (4.5–8.5 Hz) over delta (Th/De, indicative of theta activity) are shown for EEG. Total activity (1.5–58 Hz) is shown for EMG. Parallel increases in gamma and theta reflect cortical activation during wake and PS, which is also accompanied by low EMG activity, whereas high delta activity reflects SWS. Note on days 2 and 3, the persistence of SWS marked by high-amplitude delta, despite the deprivation of PS. The recovery and rebound of PS is evident on day 4 by the presence of high-amplitude gamma and theta activity with diminished EMG. Activity displayed as amplitude units scaled to maximum.

