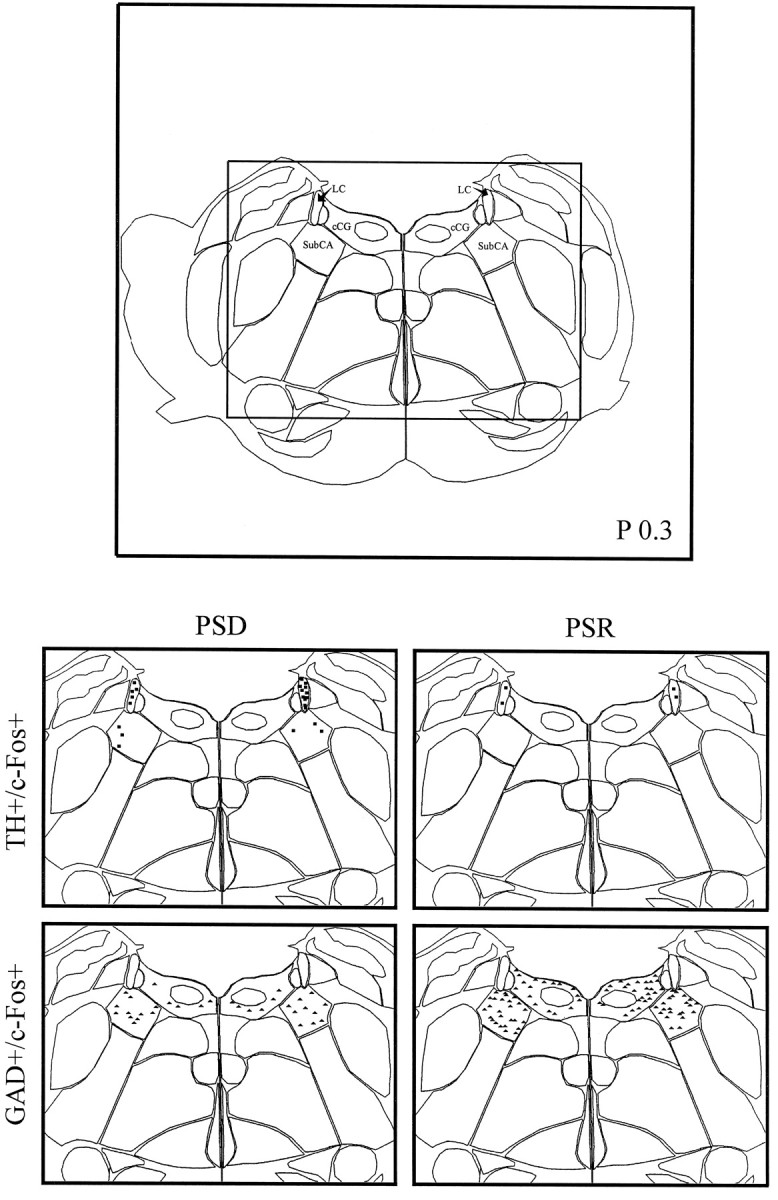
Fig. 8.

Computerized atlas figure through the pontomesencephalic tegmentum (∼P 0.3) showing noradrenergic cell group and surrounding caudal central gray (top) where TH+/c-Fos+ cells (squares) and GAD+/c-Fos+ cells (triangles) were mapped (bottom) in representative animals from PSD (left) and PSR (right) groups. Note the apparent decrease in TH+/c-Fos+ cells and increase in GAD+/c-Fos+ cells in the PSR condition compared with the PSD condition. cCG, Caudal central gray;LC, locus coeruleus; SubCA, subcoeruleus nucleus, α part.
