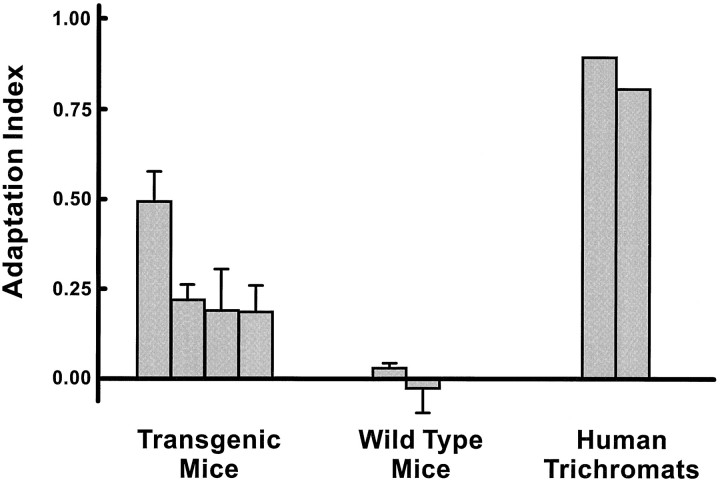
Fig. 8.
Results from a chromatic adaptation test. The adaptation index is based on a comparison of four thresholds (2 heterochromatic, 2 homochromatic) measured in a discrimination task. See Results for details. Values for the mice represent means (error bars represent 1 SD) for five replications of the experiment. Two trichromatic human subjects were tested in a single session.

