
Fig. 10.
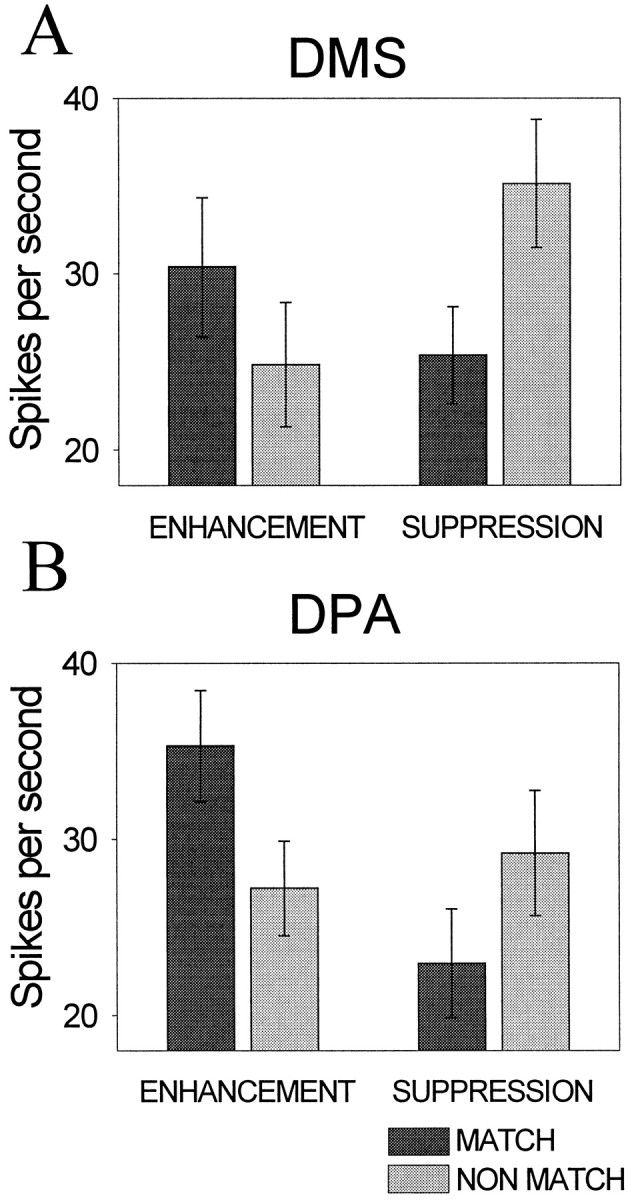
Match–nonmatch effects in the DMS (A) and DPA (B) tasks. Eachpair of bars shows the average firing rate to matching (targets) and nonmatching (nontargets) test objects for stimuli that elicited significant enhancement or suppression of responses to matches relative to nonmatches. The error bars show the SD.