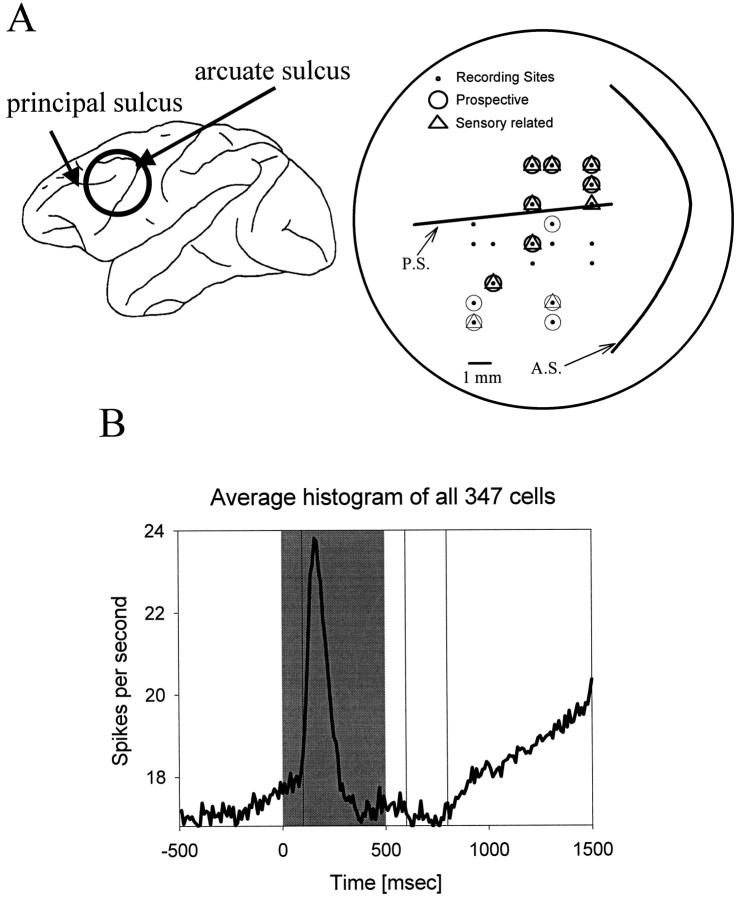
Fig. 2.
A, Location of recording sites. The recording sites were located around the principal sulcus and on the inferior convexity of the prefrontal cortex. Recording sites in the two monkeys were intermixed and nonoverlapping. The circlesand triangles depict where prospective and sensory-related cells were found. Recording sites from monkey A are shown as thick symbols, and those from monkey B are shown as thin symbols. B, Average histogram for all recorded cells. The curve represents the mean firing rate (bin width, 10 msec). The shaded gray area represents the period of sample object presentation. Theblack vertical lines delineate the sample and delay epochs described in Materials and Methods.

