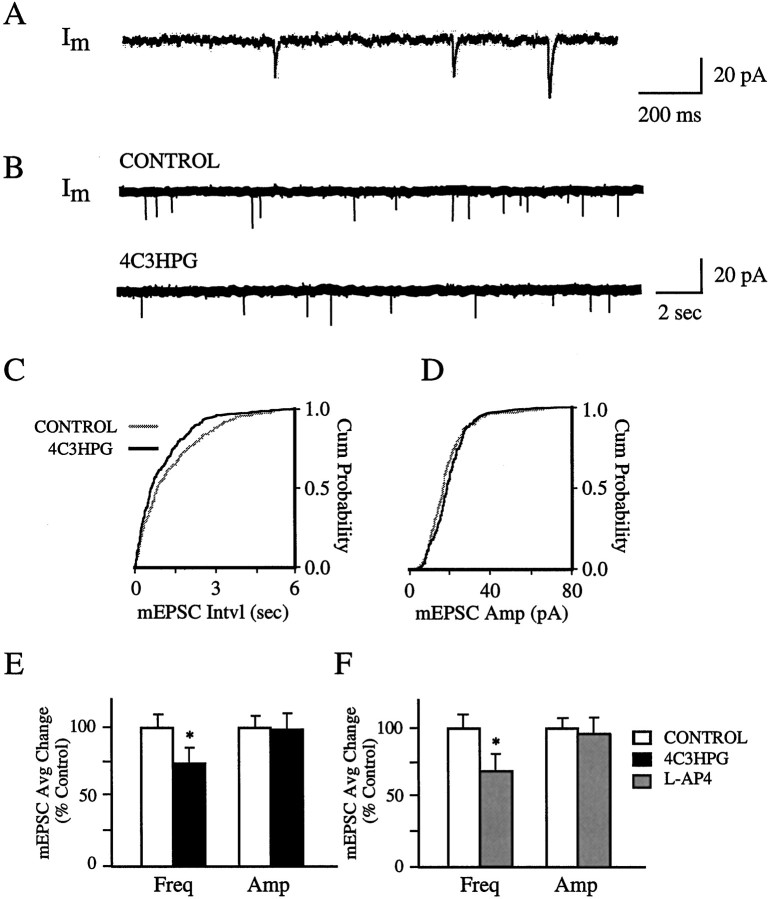
Fig. 7.
Effect of group-II and group-III agonists on mEPSCs in PMNs. A, Raw trace with higher temporal resolution showing typical mEPSCs after bath application of TTX (1 μm). B, Top, Rawtrace showing mEPSCs before drug treatment.Bottom, Decrease of mEPSC frequency after 4C3HPG (30 μm, bath) treatment. C, Cumulative (Cum) interval (Intvl) histograms of mEPSCs from the cell represented in B before (1012 events; gray curve) and after (810 events; black curve) bath application of 4C3HPG, which induced a significant (p < 0.01) rightward shift in the cumulative distribution of mEPSC intervals (i.e., a decrease in mean EPSC frequency). D, Cumulative amplitude (Amp) histograms of mEPSCs from the same data sets shown in C. Note that there was no significant (p > 0.05) difference in the amplitude distributions between control and 4C3HPG conditions. Statistical significance for the difference between distributions was assessed by the Kolmogorov–Smirnov test. E, F, Summary of 4C3HPG (E) and l-AP4 (F) effects on the amplitude (Amp) and frequency (Freq) of mEPSCs. Each value (mean ± SEM) was obtained by averaging the percentage changes of mean amplitude or interval (as the reciprocal of frequency) from cells tested with 4C3HPG (30 μm, bath; n = 5) orl-AP4 (5 μm, bath; n = 4). An asterisk indicates a significant difference (p < 0.05; t test) from control values.

