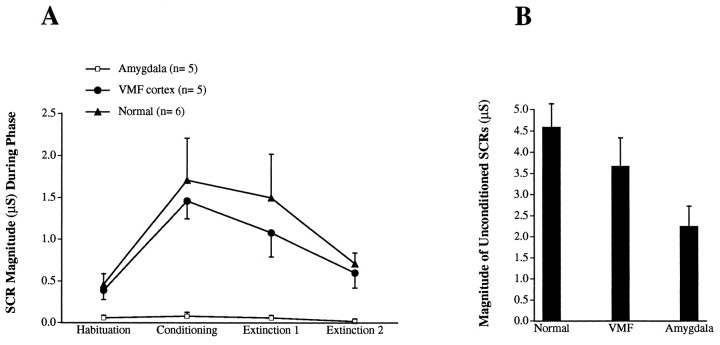
Fig. 5.
A, Magnitudes of SCRs in the conditioning phase as compared with the SCRs in the habituation and extinction phases. Each point on the plot represents the means ± SEM of the magnitudes of SCRs generated by control subjects, amygdala, and VMF patients during each phase of the conditioning experiment. Each Habituation score represents the mean (from n = 6 controls, 5 VMF, and 5 amygdala patients) of the mean magnitude of SCRs generated in response to the last three slides preceding conditioning. EachConditioning score represents the mean of the mean magnitude of SCRs generated in response to six presentations of the CS (not followed by the US). Each Extinction 1 score represents the mean of the mean magnitude of SCRs generated in response to the first three repeated presentations of the CS during extinction. Each Extinction 2 score represents the mean of the mean magnitude of SCRs in response to the last three repeated presentations of the CS. B, Magnitudes of SCRs to the blue slides (CS) that were paired with the US during conditioning. Eachcolumn represents the mean ± SEM of the mean magnitude of SCRs generated in response to six presentations of the CS (paired with the US) from the same control subjects and brain-damaged patients as in A.

