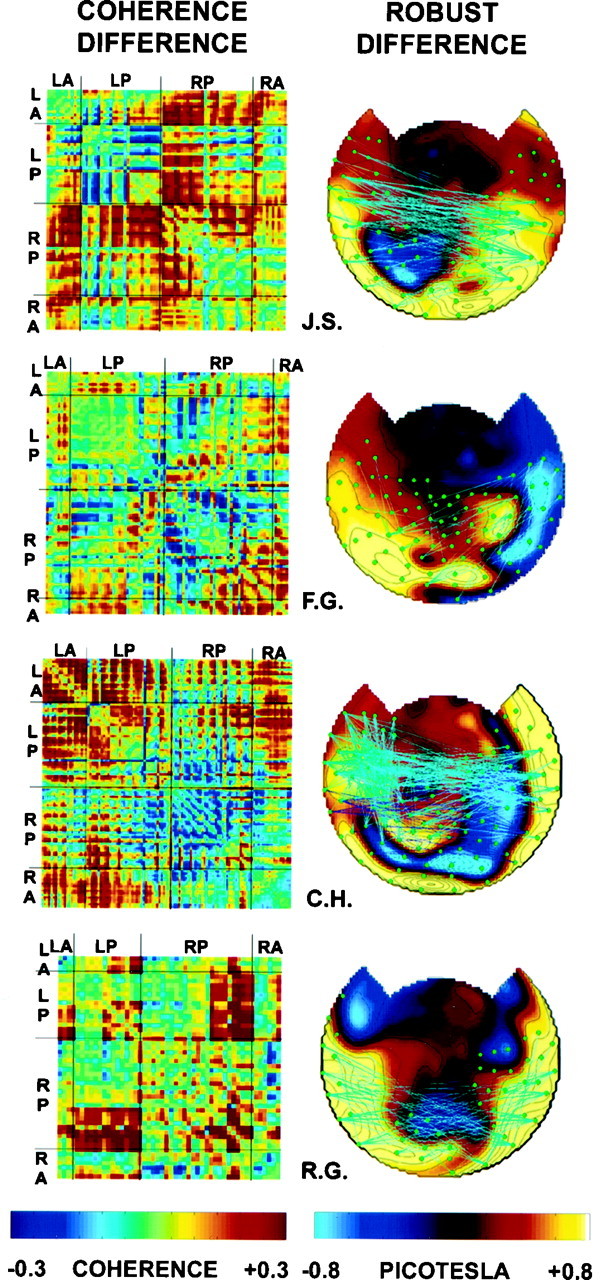
Fig. 10.

Coherence differences in four subjects.Left, Coherence difference matrices, plotted as described in Figure 9. Note that most coherences are higher during dominance. The summed squared coherence differences were significant (p < 0.05) in each subject as determined by the use of a randomization test. Right, Topographic map of robust coherence differences, plotted as described in Figure9.
