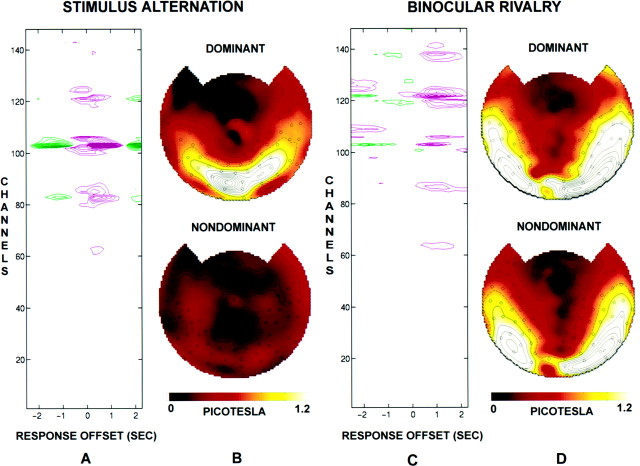
Fig. 3.
Analysis of the temporal offset between subject J.S.’s response functions and steady-state power differences. The power spectrum was calculated with the response function offset from the MEG data by an offset time τ ranging from −2.5 to +2.5 sec in steps of 0.25 sec. All plots show power at the single frequencyfc = 7.41 Hz that was used in all eight rivalry trials and four stimulus-alternation trials. A, Power difference as a function of offset time and channel number for the stimulus-alternation trials. The contour lines inmagenta indicate positive power differences (power is greater during episodes reported as dominant by the subject);green lines indicate negative differences in power.Contour lines are shown at 0.05 picotesla2 and are higher in steps of 0.025 picotesla2. B, Topographic display of amplitude corresponding to perceptual dominance (top) and to perceptual nondominance (bottom) for stimulus-alternation trials, at the offset for which the difference was maximal (τ = 0.25 sec). There is essentially no power during nondominance, because no stimulus is presented at that frequency during those intervals. C, Power difference for the rivalry trials, plotted as described in A. D, Topographic display of amplitude for the rivalry trials, plotted as described in B. During rivalry the offset for which the difference was maximal was τ = 1.0 sec. Note that for rivalry trials there is still considerable power during nondominance, even though the stimulus is not perceived.

