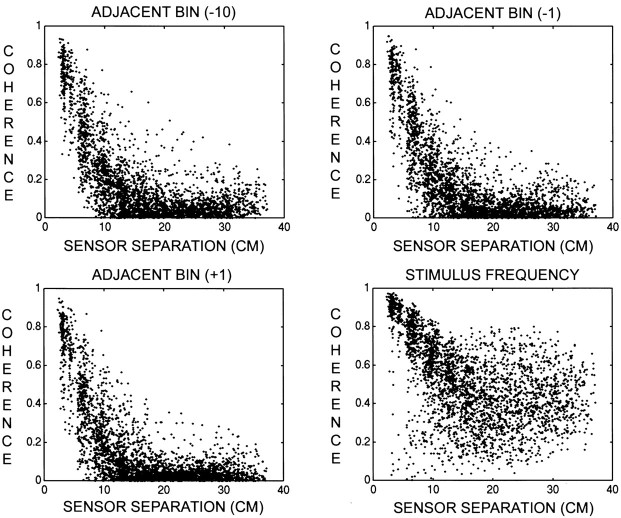
Fig. 6.
Scatter diagrams of coherence versus sensor separation for subject S.P. Sensor-separation distances were calculated on the best-fit sphere to the sensor positions. This sphere has a radius of 12 cm, and the typical separation between neighboring sensors is 3 cm. The stimulus frequency isfc = 7.41 Hz. The frequency resolution for the coherence calculations was Δf = 0.016 Hz. Only sensors with SNR >5 were included. Top left, Scatter plot for the frequency fc − 10Δf. Top right, Scatter plot for the frequency fc − Δf.Bottom left, Scatter plot for the frequencyfc + Δf. Bottom right, Scatter plot for the frequencyfc. Note that at all three unstimulated frequencies the coherence exhibits the same steep decrease with sensor separation, becoming negligible at sensor separations of >12 cm. At the stimulus frequency, coherence is generally >0.5 at all separations.

