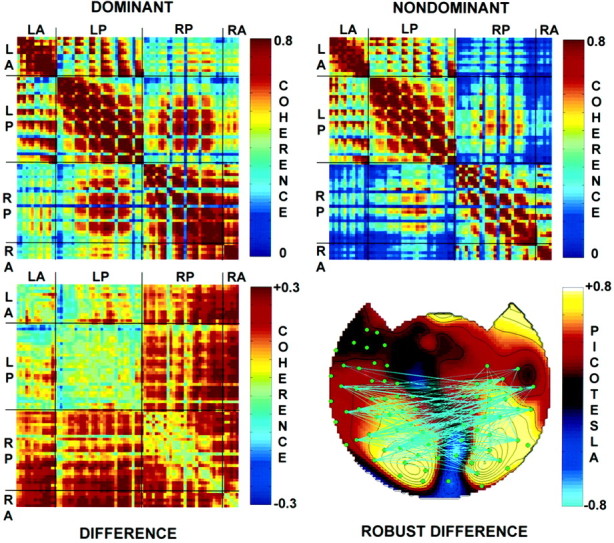
Fig. 9.

Topography of coherence during perceptual dominance and nondominance in subject S.P. Top left, Coherence matrix during perceptual dominance. In this channel-by-channel matrix, the channels are sorted into groups:LA, left anterior; LP, left posterior;RP, right posterior; and RA, right anterior. Top right, Coherence matrix during perceptual nondominance. Bottom left, Coherence difference matrix obtained by subtracting coherence during perceptual nondominance from coherence during perceptual dominance. Note that most of the coherences are higher during dominance. The summed squared coherence differences were significant (p < 0.005) as determined by the use of a randomization test. Bottom right, Topography of robust coherence differences. The topographic map shows the amplitude difference between dominance and nondominance.Filled green circles indicate channels with SNR >5 and a coherence >0.3 with at least one other channel. Robust differences between perceptual dominance and nondominance are indicated bycyan lines for positive differences and blue lines for negative differences. Robust differences in coherence were defined as those in which the difference exceeded twice the SE of the overall coherence.
