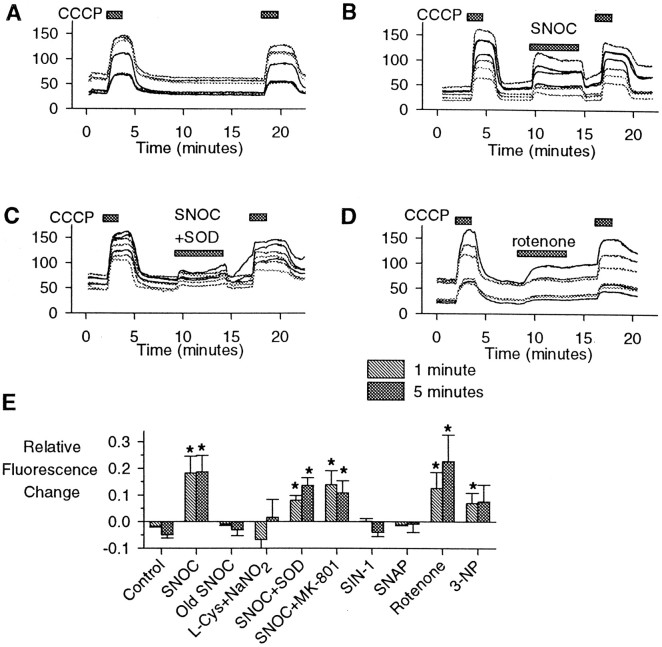
Fig. 2.
Rhodamine-123 detection of mitochondrial depolarization. Cytoplasmic rhodamine-123 fluorescence (arbitrary units) versus time for seven representative hippocampal neurons for each experiment. A, In control experiments 90 sec exposures to CCCP (1 μm) resulted in rapid increases in fluorescence, followed by stable or slightly decreased signals over 10 min exposures. B, SNOC (1 mm) produced rapid fluorescence increases. C, The effects of SNOC were not blocked by the coapplication of superoxide dismutase (SOD; 100 U/ml). D, The complex I inhibitor rotenone (5 μm) produced slower increases in fluorescence in some imaged neurons, with little reversibility.E, Quantitative summary of rhodamine-123 fluorescence studies, comparing changes in relative cytoplasmic fluorescence after 1 or 5 min averaged over all neurons in each experiment. These values then were averaged over all experiments for each agent. The concentrations used were 1 mm for SNOC, “old SNOC,” SIN-1, SNAP, and l-cysteine (l-Cys) plus NaNO2, 100 U/ml for SOD, 1 μm for MK-801, 5 μm for rotenone, and 1 mm for 3-nitropropionic acid (3-NP) (mean ± SEM; *p < 0.05; n = 6–10 experiments for each condition).

