
Fig. 9.
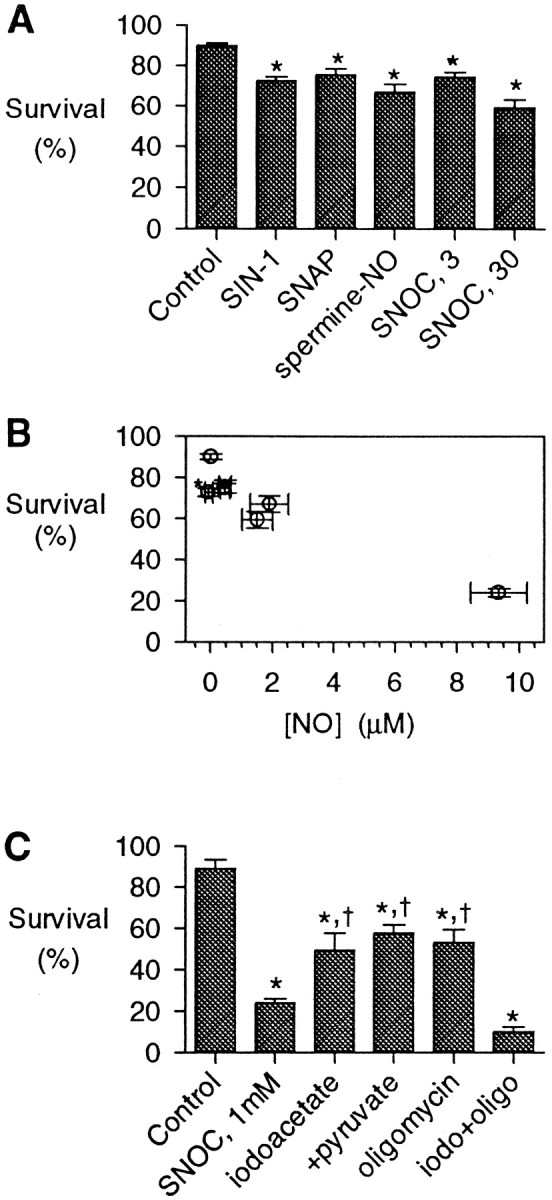
Neuronal survival after energy-depleting treatments. A, Neuronal survival was assayed 1 d after 20 min exposures to control buffer, SIN-1 (1 mm), SNAP (1 mm), spermine-NO (300 μm), or SNOC (3 or 30 μm). Each agent produced a modest decrease in survival (n = 4; *p < 0.05).B, The survival at 24 hr after exposure to each NO donor was correlated with the measured [NO] produced by each agent. SIN-1 (asterisk) was anomalous, producing toxicity without producing a measurable [NO] (see Table 1). C, Survival assayed 1 d after 20 min exposures to high [NO], ∼9 μm, from 1 mm SNOC as compared with metabolic inhibitors (mean ± SD; n = 4; *p < 0.05 compared with controls and†p < 0.05 compared with SNOC alone). The concentrations used were as above.