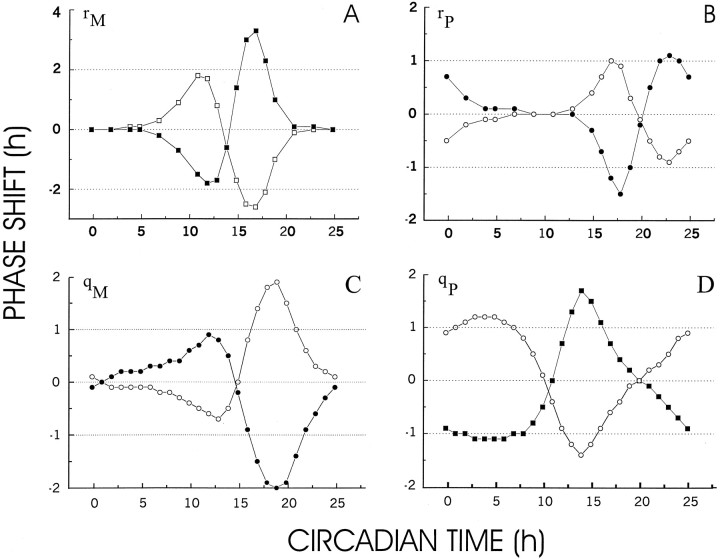
Fig. 6.
A, Phase–response curve for a single pulse of 1 hr duration of mRNA production stimulation (open squares) and inhibition (filled squares). During stimulation, parameterrM was changed from a value of 1 into a value of 2, whereas during inhibition the value was set at zero.B, Phase–response curve for a single pulse of 1 hr duration of protein production stimulation (open squares) and inhibition (filled squares). During stimulation, parameter rP was changed from a value of 1 into a value of 2, whereas during inhibition the value was set at 0. C, Phase–response curve for a single pulse of 1 hr duration of mRNA degradation stimulation (open squares) and inhibition (filled squares). During stimulation, parameterqM was changed from a value of 0.21 into a value of 0.42 (SqM = 0.21), whereas during inhibition the value was set at 0 (SqM = −0.21). D, Phase–response curve for a single pulse of 1 hr duration of protein degradation stimulation (open squares) and inhibition (filled squares). During stimulation, parameter qP was changed from a value of 0.21 into a value of 0.42 (SqP = 0.21), whereas during inhibition the value was set at 0 (SqP = 0.21).

