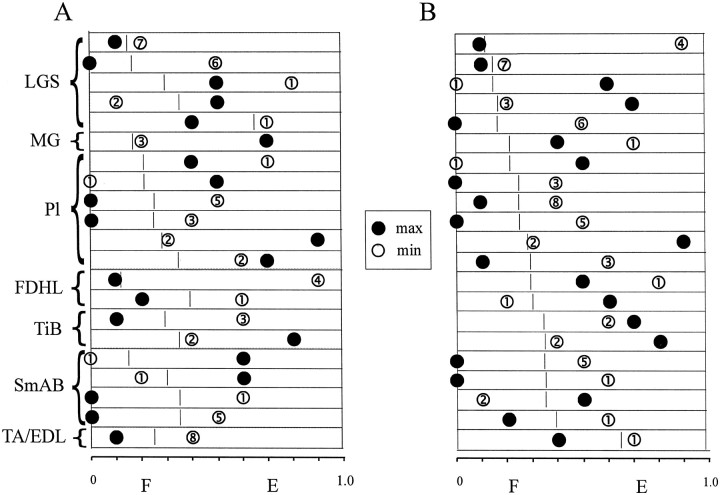
Fig. 5.
Phase plots of maximal and minimal PAD amplitude. PADs in all illustrated trials were evoked by stimulation of the same nerve (PBSt). A, Trials are grouped according to the muscle of origin as indicated on the left. Maximal and minimal amplitude of PADs are represented by filled andopen circles, respectively. The numbersin the open circles are the number of bins significantly modulated. For each axon, the locomotor cycle is represented by abox, with the flexor (F) and extensor (E) phases separated by a short vertical line. B, Trials are grouped according to the proportion of the flexor phase within the fictive step cycle, increasing from top to bottom.

