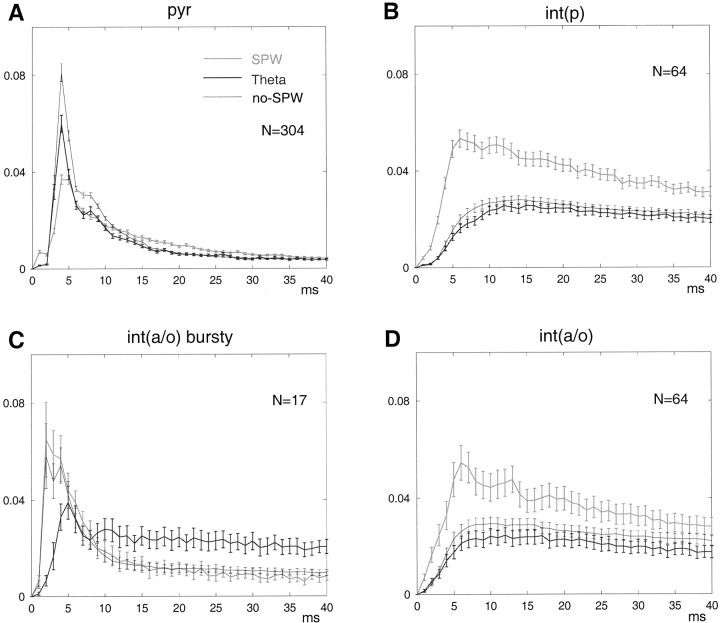
Fig. 10.
State-dependent discharge patterns inpyr (A), int(p)(B), and int(a/o)(C, D). Autocorrelograms were calculated for each network state (theta, SPW, andno-SPW). A, Note the large, sharp peaks at <5 msec, indicating complex-spike bursts of pyramidal cells.B, D, Note also peaks during SPW at 6 msec in int(p) (B) and mostint(a/o) (D) interneurons.C, A subgroup of int(a/o) displayed high frequency (>300 Hz) burst discharges.

