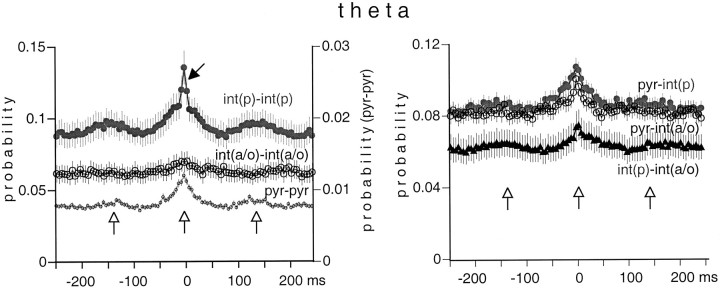
Fig. 11.
Averaged cross-correlograms of cell pairs during theta oscillation. Note the rhythmic peaks in the cross-correlograms ofint(p)–int(p) andpyr–pyr pairs (left) andint(p)–int(a/o) pairs (right) at theta frequency (vertical open arrows). The narrow peak in theint(p)–int(p) histogram (left) reflects a prominent gamma frequency oscillation of these neurons (black arrow).

