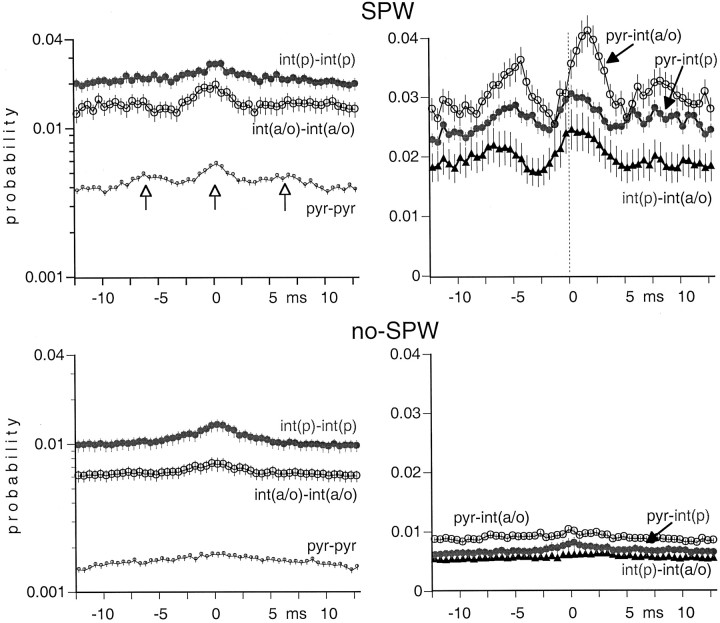
Fig. 12.
Averaged cross-correlograms of cell pairs during SPW bursts and between SPW events (no-SPW). Note the rhythmic peaks in the histogram of pyramidal neurons (vertical open arrows). Note also the time-shifted peaks of pyr–int(a/o) pairs. The discharge probabilities during no-SPW epochs were low for each group.

