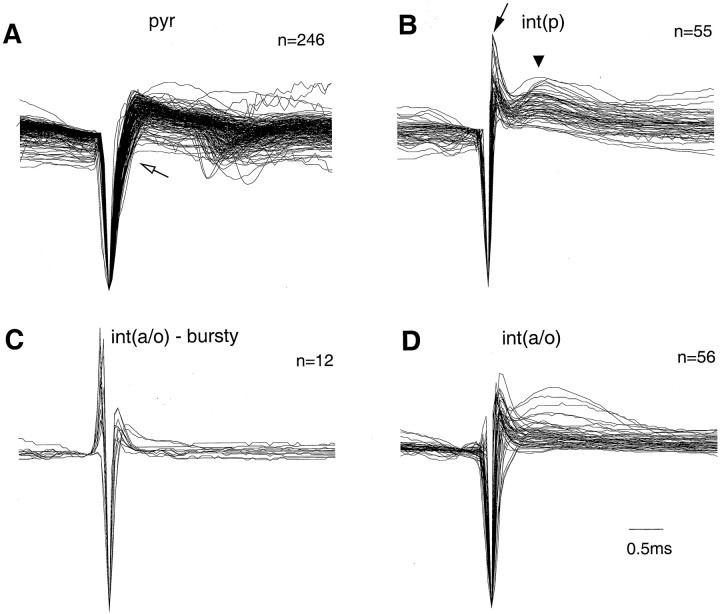
Fig. 3.
Waveform differences of pyramidal cells and interneurons. Superimposed average traces of all pyramidal cells and putative interneurons. The waveforms (averages ofn > 200 individual spikes) were amplitude normalized for this display. Filters settings were 1 Hz and 5 kHz.A, Note the wider negative spike component ofpyr and a change in slope of the ascending phase (open arrow). B, Note also the uniform waveforms of the putative int(p). The sharp positive spike (filled arrow) usually is followed by another positive component at 0.8 msec (triangle).C, D, Putative int(a/o)displayed more variability. Waveforms of cells with fast (>250 Hz) bursts (see Fig. 10C) are shown separately (bursty). Note that in most bursty cells the waveform is characterized by an early positive component.

