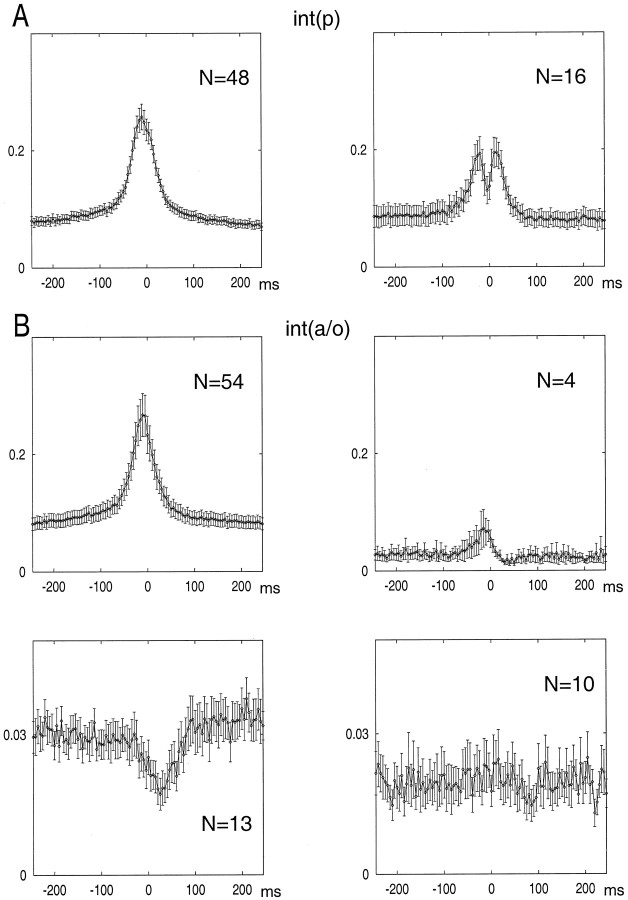
Fig. 8.
Group data for the interneuron types shown in Figure 5. A, Int(p) had either a single peak (left) or double peaks (right) before and after the maximum discharge probability of pyramidal cells.B, Most int(a/o) had a single peak (upper left), whereas others were either suppressed after the population discharge of pyramidal cells (lower left; anti-SPW cells) or were not affected by the SPW burst (lower right; SPW-independent cells). A few cells had a significant suppression after an initial excitation (upper right).

