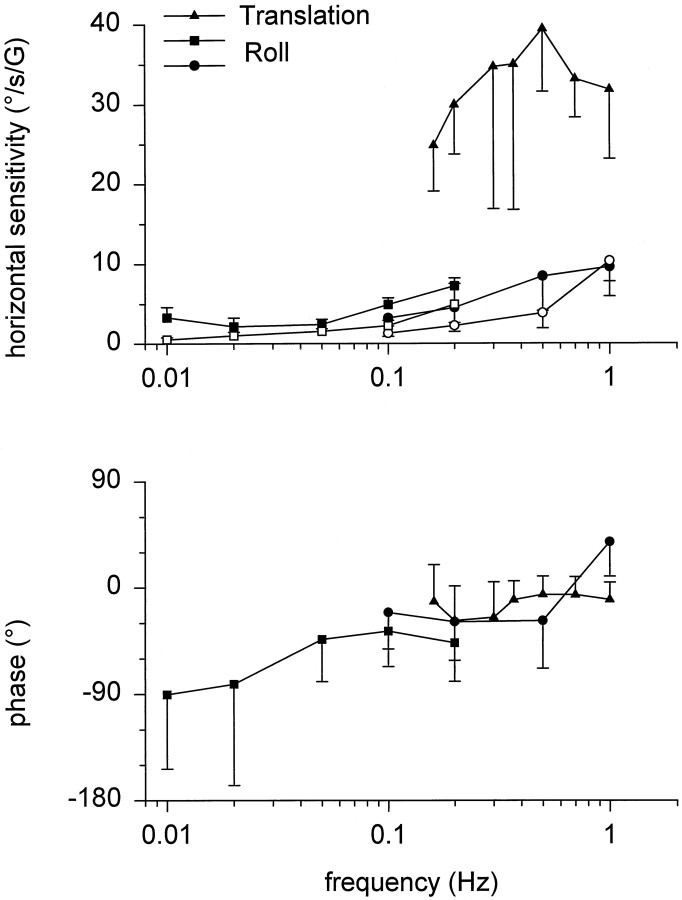
Fig. 3.
Comparison of horizontal eye velocity elicited during roll and translation. Mean ± SD peak horizontal eye velocity sensitivity (expressed in degrees/second/gravity, where G = 9.81 m/sec2) and phase have been plotted separately for earth-horizontal and earth-vertical roll oscillations (filled and open symbols, respectively). Roll oscillations: squares, ±90° (0.01–0.2 Hz); circles, ±22° (0.1–0.5 Hz) and ±5° (1 Hz); lateral translations: triangles(Angelaki, 1998, Fig. 6, average data from five animals replotted).

