
Fig. 2.
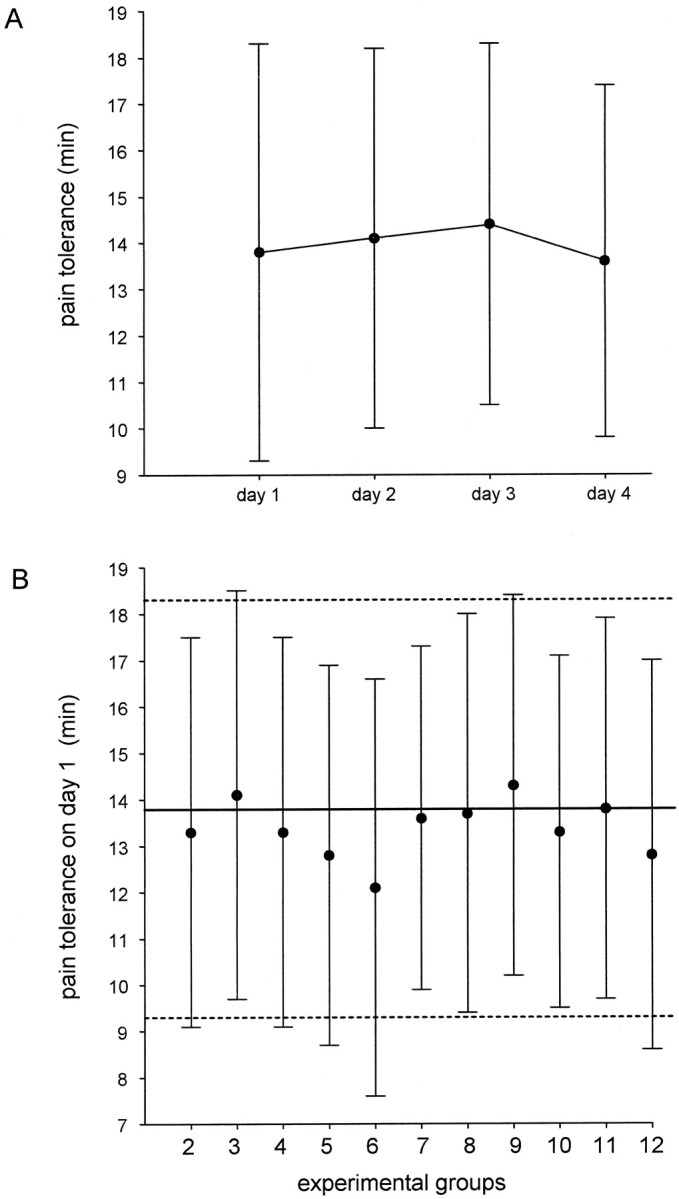
Analysis of the natural history of ischemic pain.A, Means and SDs of the natural history are shown for group 1 on 4 consecutive days. B, Pain baseline (mean ± SD) on day 1 in all groups and comparison with the natural history group on day 1. The horizontal bold linerepresents the mean of day 1 shown in A, thebroken lines represent the SD. The statistical analysis of the natural history is shown in Table 2.