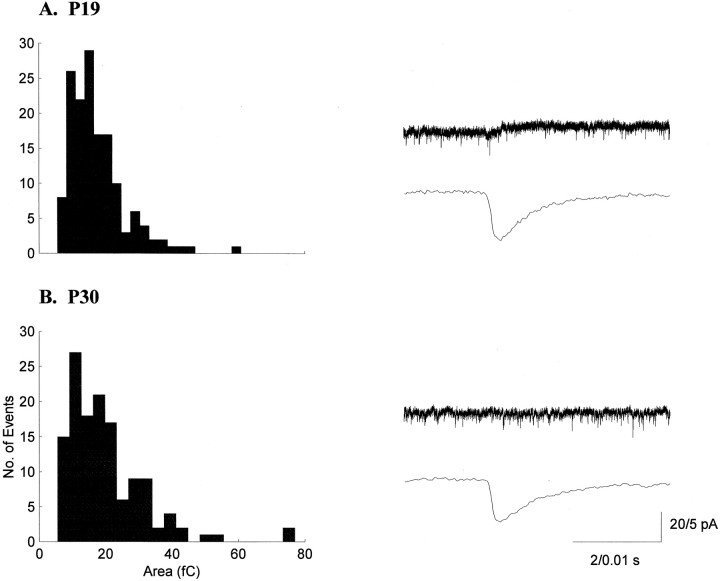
Fig. 1.
sEPSC areas in the LGN are stable during ON/OFF sublamination. Histograms of sEPSC areas and example current traces from a P19 (A) and a P30 (B) neuron are shown. Histograms for all properties measured were skewed toward larger values and showed considerable variability. The bottom traces for each neuron are averages of 50 consecutive sEPSCs.

