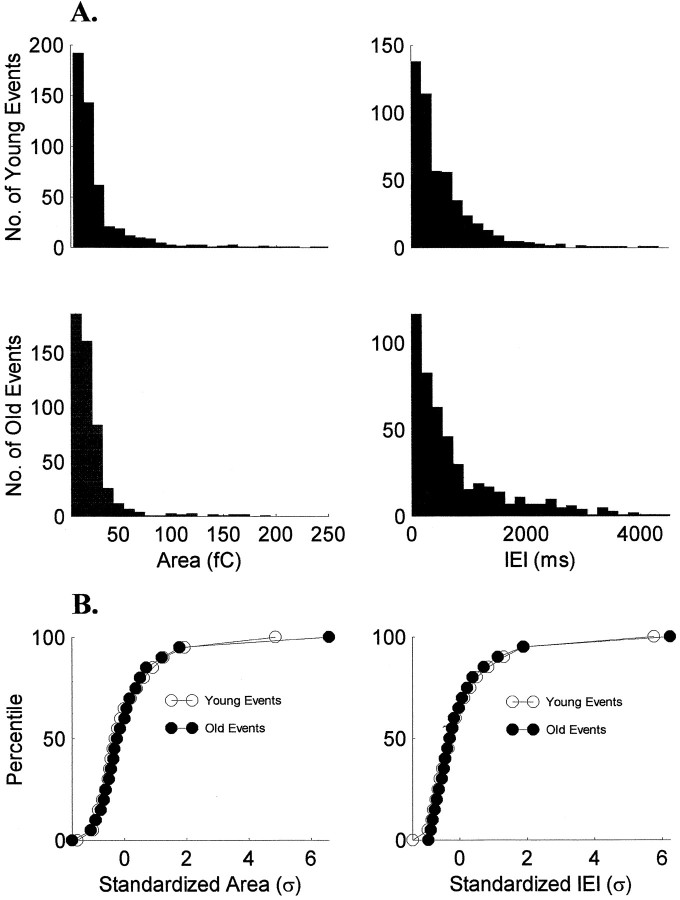
Fig. 2.
The shape of sEPSC area and IEI distributions is stable over ON/OFF sublamination. A, Histograms of pooled data from the youngest cells (n = 10) and the oldest cells (n = 10) are similar for both sEPSC area and IEIs. B, Cumulative histograms of the standardized areas and IEIs show that the shapes of the distributions did not change with age (p > 0.05, Kolmogorov–Smirnov test).

