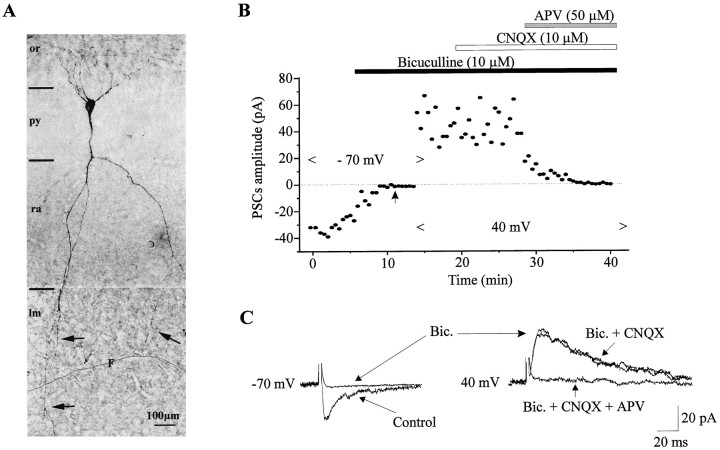
Fig. 4.
Morphofunctional characteristic of a neuron with GABA plus NMDA receptor-mediated PSCs. A, Note that this cell has a similar shape to the one shown in Figure 3A.B, Plot of the amplitude of the PSCs versus time. In control, the stimulation intensity was 50 V. Application of bicuculline (10 μm) completely blocked the synaptic response evoked at −70 mV. Increasing the stimulus intensity to 100 V (indicated by the arrow) failed to restore any synaptic response. After holding the membrane potential at 40 mV, the same stimulus intensity evoked an outward synaptic response that is insensitive to CNQX but completely blocked by further application of APV (50 μm). C, PSCs corresponding to the graph depicted in B. Each trace is the average of five consecutive PSCs. The control PSC at −70 mV is evoked at 50 V, whereas others are evoked at 100 V.

