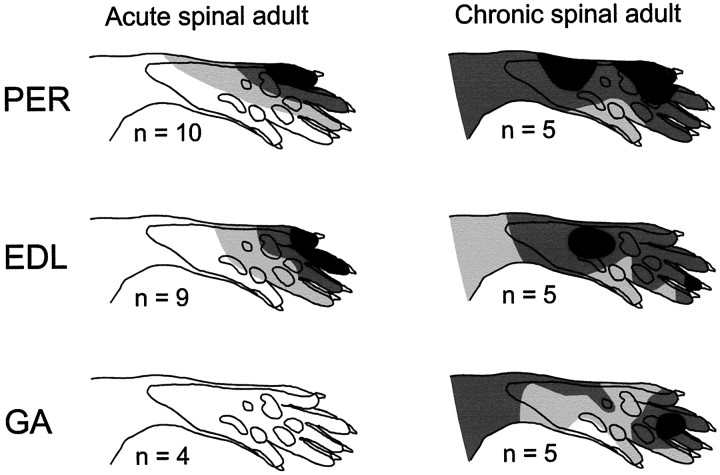
Fig. 3.
Averaged receptive fields of EDL, PER, and GA withdrawal reflexes in acute spinal rats (left column) and in rats whose spinal cords were transected at level T8–11 at birth (right column). CO2 laser stimulation was used to map the receptive fields. Light gray,dark gray, and black indicate areas of the skin from which the evoked responses were 0–30%, 30–70%, and 70–100% of the maximal response, respectively. Number of rats included in each average is indicated below each receptive field.

