
Fig. 6.
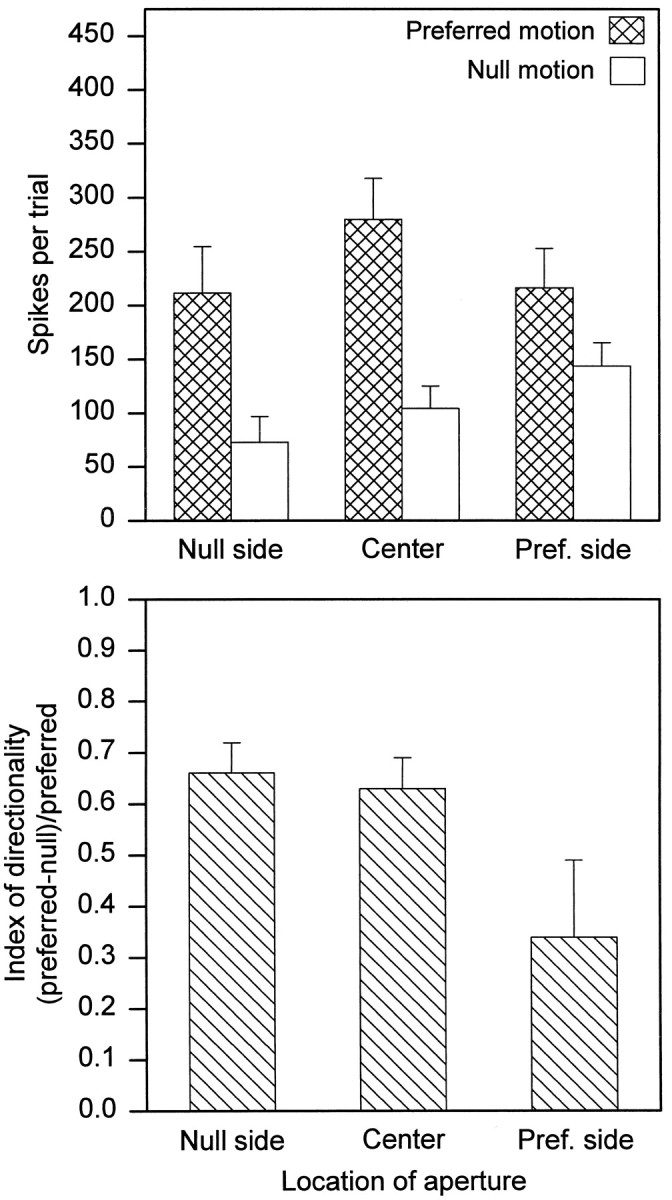
Comparison of receptive field zones for 15 cells. The cells were tested with edges moving behind apertures located at one of the three positions within the receptive field, as shown in Figure6; the stimulus parameters were the ones used there. Here the responses to leading and trailing edges are combined. Means ± SEM.