
Fig. 1.
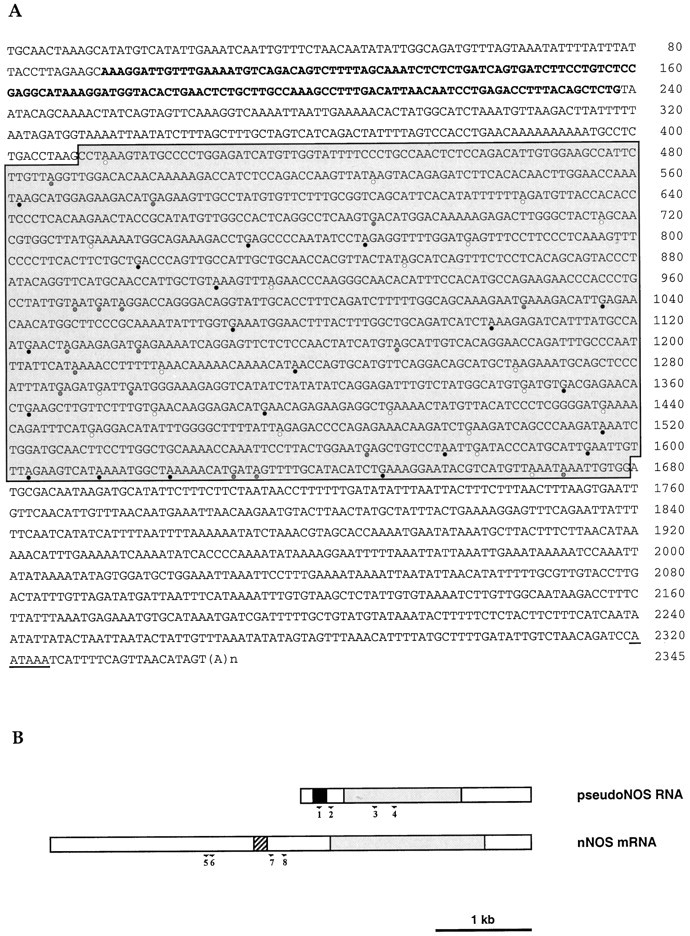
Molecular cloning of the pseudo-NOS transcript.A, Sequence of a full-length cDNA clone isolated from aLymnaea CNS cDNA library. The antisense region from 93 to 238 bp is indicated in bold type. The core region of high homology (>80%) to the nNOS-encoding transcript isshaded. A polyadenylation signal isunderlined. Stop codons within the core region are marked by circles: white, frame 1;shaded, frame 2; and black, frame 3.B, Schematic representation of the pseudo-NOS and nNOS-encoding transcripts. The antisense region in the pseudo-NOS transcript and its complementary counterpart are shown byblack and hatched boxes, respectively. Regions of high homology are shaded, and the unfilled areas have no significant homology to one another. The positions of the numbered primers used in RT-PCR experiments on isolated identified neurons are shown by arrows.