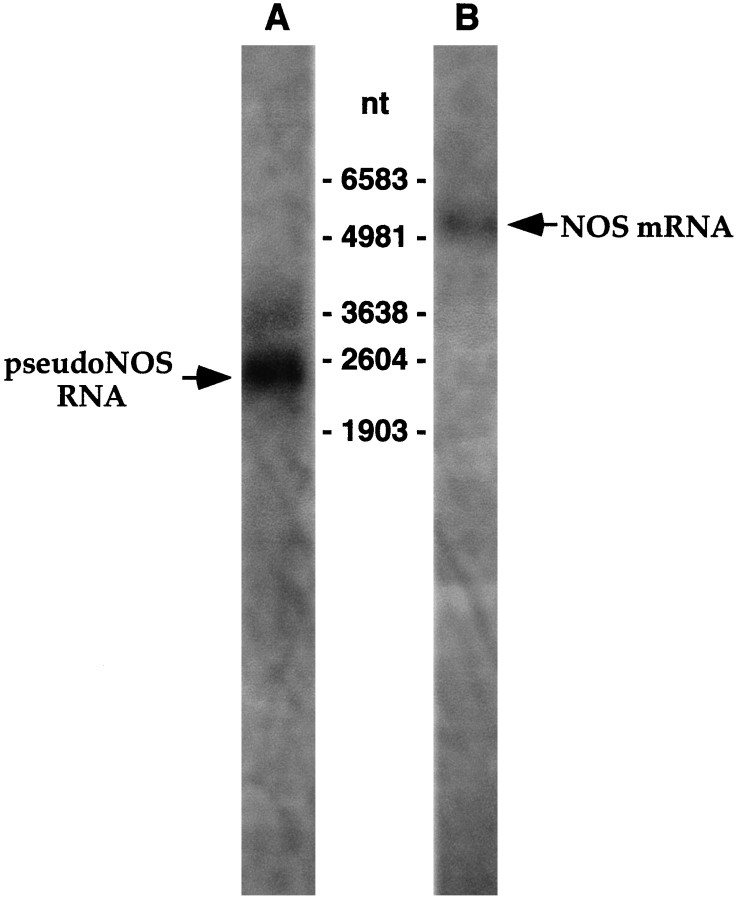
Fig. 3.
The pseudo-NOS and nNOS-encoding transcripts are expressed in the Lymnaea CNS. Northern blot analysis ofLymnaea CNS poly(A+) RNA using a probe specifically recognizing the antisense region of the pseudo-NOS transcript identifies a prominent band of the expected size (∼2500 nt) in lane A (arrow). A less prominent transcript of ∼3200 nt is also revealed in the experiment. This suggests that there are other RNA molecules in the CNS that are antisense to the nNOS-encoding transcript. In lane B, the result of the hybridization with a probe recognizing the 3′ untranslated end of nNOS mRNA is shown. As expected, a single transcript of ∼5000 nt is revealed (arrow).

