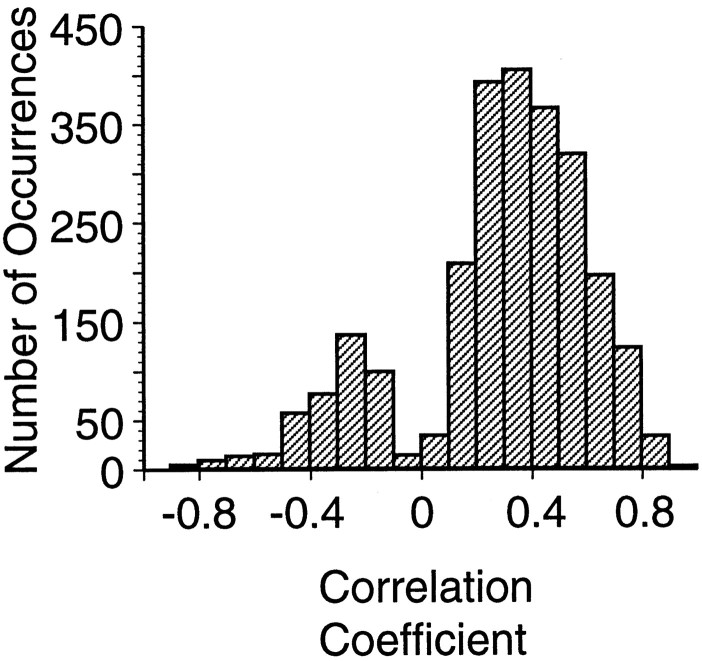
Fig. 3.
Distribution of response correlations between pairs of MI neurons that were significantly different (p < 0.01) from the shuffled responses. The distribution is constructed from 2502 correlation coefficients calculated for each cell pair in each of the eight movement directions. The bimodal distribution is a result of the removal of the nonsignificant correlation coefficients.

