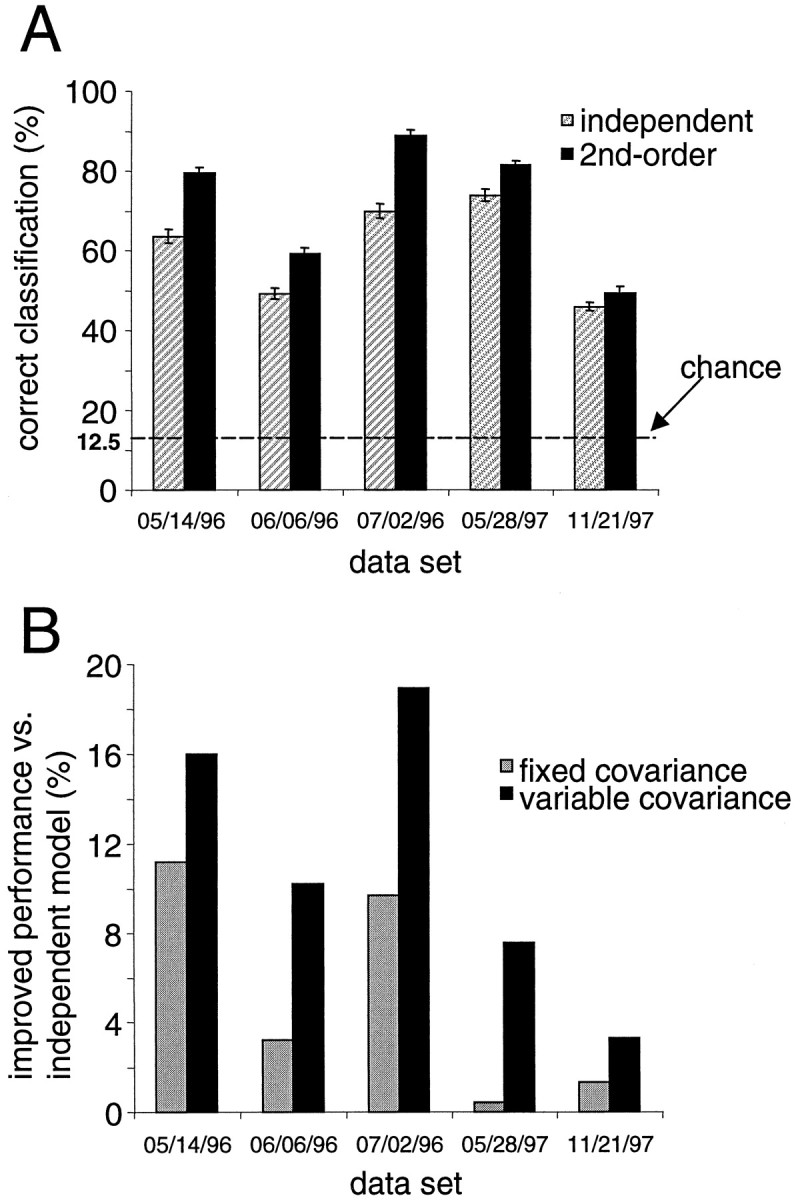
Fig. 8.

A, Results of applying two models to decode the direction of movement from the population of neural responses. Dark bars (second order) are the percentage of trials in which a model incorporating correlations in the trial-to-trial responses of pairs of neurons correctly estimated the movement direction. Hatched bars (independent) are the numbers of trials for which a model that did not incorporate the correlations between cells correctly predicted the direction of movement. These models were applied to five experimental data sets denoted by a seven α-numeric code. B, A comparison in performance of two versions of the second-order model. The improved classification performance of the original second-order model as compared to the independent model is labeled as the “variable covariance” model (black bars). In the other version, the covariance matrix used was fixed and was set to the average over the eight movement directions (gray bars). Notice how the original second-order model does consistently better than the fixed covariance model over all data sets.
