
Fig. 10.
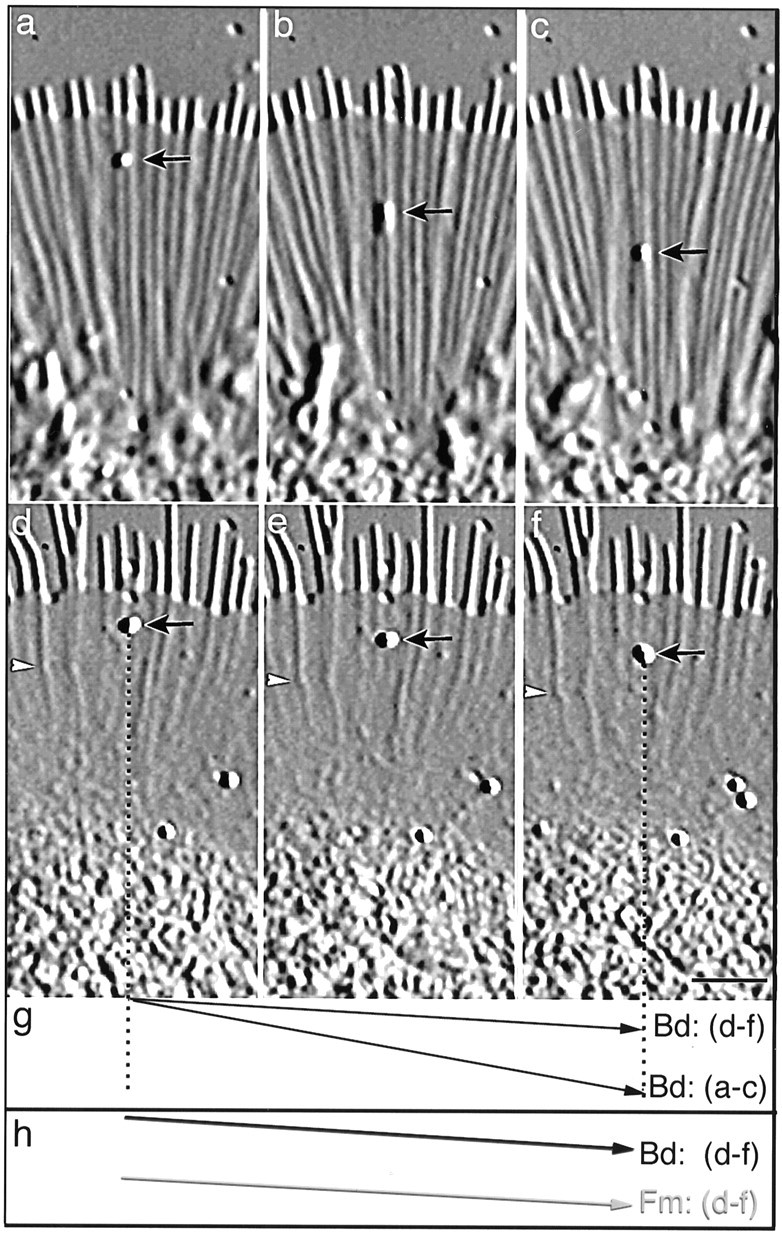
Increased [Ca2+]i results in inhibition of retrograde flow. a–c shows a region of the growth cone before treatment with high K+, andd–f shows the same region 30 min after treatment with high K+. Short arrows point to beads (200 nm polystyrene beads) on the surface of the growth cone, and thearrowheads in d–f point to a fiduciary mark on a rib. The time interval is 30 sec between each image ina–c and d–f. The displacement vectors in g and h represent the path of the bead (Bd) or fiduciary mark (Fm) relative to the leading edge over a 1 min interval, where the Δy = retrograde movement and the Δx = time. The velocity of bead movement decreases from 4.0 μm/min (a–c) to 1.1 μm/min after 30 min in high K+(d–f), as indicated by the decrease in slope of the displacement vector (g). Note the significant changes in filopodial length, rib length, and lamellipodial width that also occur after high K+(d–f). Also, the bead (arrow) ind–f moves at the same rate as the fiduciary mark on the rib (1.1 μm/min) (arrowhead), which we have previously shown to be composed of F-actin (Welnhofer et al., 1997). This is also illustrated in h by the same slopes of their displacement vectors. The Fm displacement vector was offset relative to the Bd displacement vector to ease comparison. Scale bar, 5 μm.