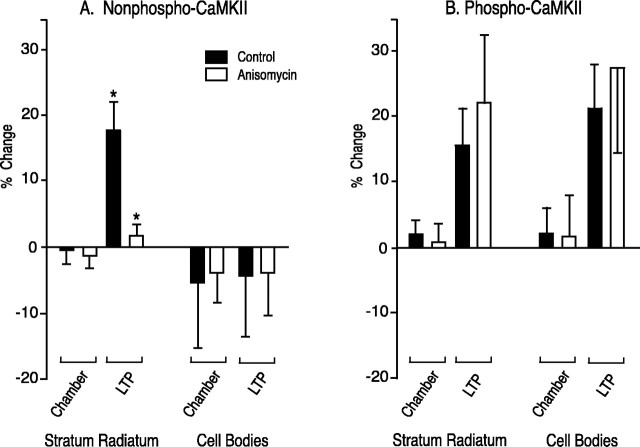
Fig. 2.
Quantitative analysis of the ratio of staining in the tetanized region of area CA1 to that in the control region 30 min after tetanic stimulation in the presence and absence of anisomycin. The data from Table 1 are plotted as percent deviation from 1.0 of the ratio of brightness in the tetanized region to brightness in the control region in stratum radiatum and in the cell body layer of area CA1. Ratios from chamber control slices and from slices in which LTP was induced by tetanus in the presence and absence of anisomycin are shown side by side. The data are the average ± SEM of 27 sections from nine chamber control slices and 30 sections from 10 tetanized slices treated in the absence of anisomycin and 14 sections each from seven chamber control slices and seven tetanized slices treated in the presence of anisomycin. A, Percent change in NP-CaMKII between tetanized and control regions of sections. ANOVA followed byt test showed that the change in NP-CaMKII in stratum radiatum after induction of LTP by tetanus is abolished in the presence of anisomycin. B, Percent change in P-CaMKII between tetanized and control regions of sections. No significant differences were observed between brightness values for P-CaMKII in the presence and absence of anisomycin. Solid bars, Control without anisomycin; open bars, with anisomycin; *p < 0.002.

