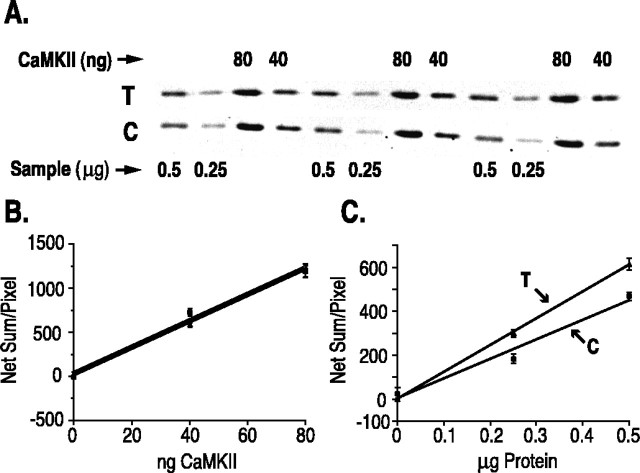
Fig. 3.
Quantitative immunoblot of the α-subunit of CaMKII. A, Example of a quantitative immunoblot. Slices were tetanized as described in Materials and Methods and then frozen. Tetanized and control halves of individual slices were dissected and homogenized separately in SDS sample buffer. After determination of the protein concentration of each homogenate, samples of each (0.25 and 0.5 μg) were loaded in triplicate onto SDS-PAGE gels as described in Materials and Methods. CaMKII purified from forebrain (40 and 80 ng of α-subunit) was loaded in triplicate onto adjacent lanes as a standard. Immunoblots were prepared with a fluorescein-conjugated secondary antibody and imaged with a FluorImager. Immunoblot of a homogenate from a tetanized half of stratum radiatum is labeledT. The immunoblot of the corresponding control half of stratum radiatum is labeled C. B, Standard curve of fluorescence intensity plotted against nanograms of purified CaMKII. Quantitative measurements of fluorescence were made as described in Materials and Methods. C, Fluorescence intensity of α-subunit bands from tetanized (T) and control (C) samples shown inA, plotted against a microgram protein sample. The concentration of α-subunit in each homogenate (Fig. 4) was calculated as nanograms per microgram of protein by comparison with the standard curve. Both the standard curve (B) and values for the unknown samples (C) were measured in the linear range of the assay.

