
Fig. 2.
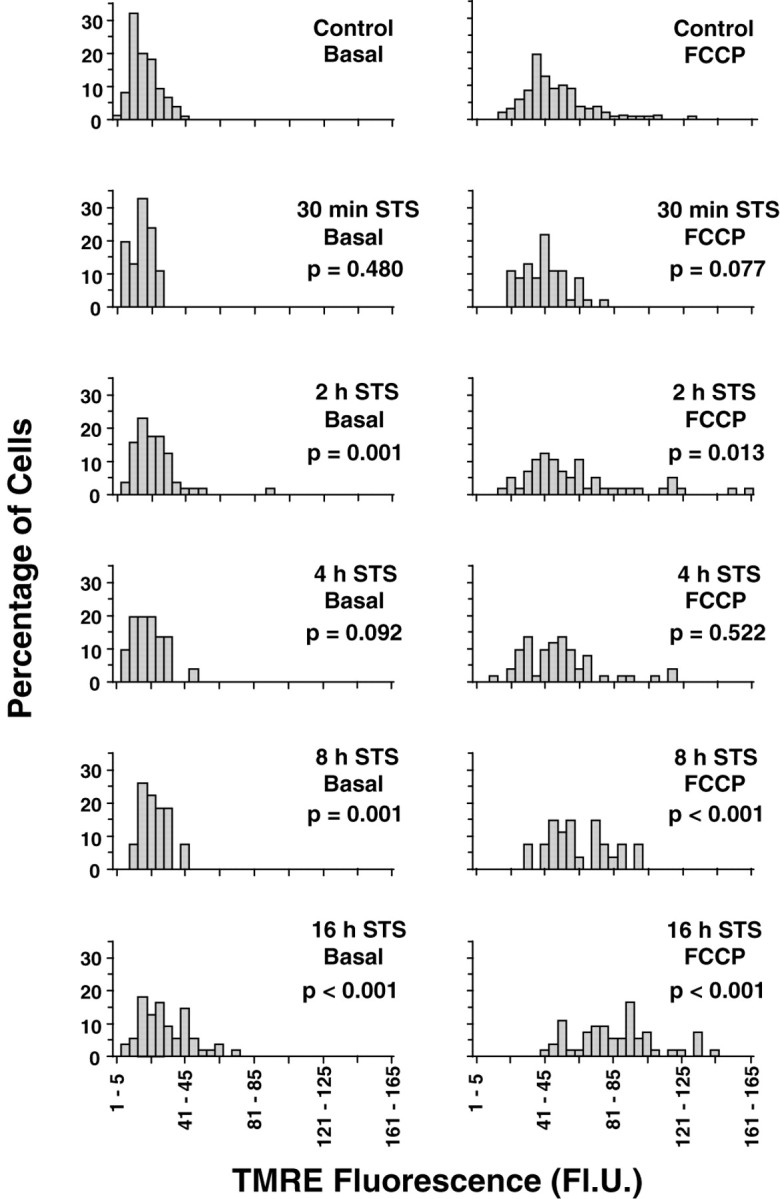
Histogram representation of cellular TMRE fluorescence during the course of staurosporine-induced apoptosis. After the indicated lengths of exposure to 300 nmstaurosporine, hippocampal cultures were incubated with 100 nm TMRE, and fluorescence was acquired using digital video microscopy. The x-axis represents fluorescence intervals into which the data were grouped, whereas the y-axis shows the percentage of cells from each treatment with fluorescence values within a given interval. Values in the left column represent baseline TMRE fluorescence (Basal). Values in the right column represent the peak fluorescence after exposure to 0.1 μm FCCP, when the dye is released from mitochondria after depolarization (“fluorescence unquenching”). In both cases, there is a progressive shift toward the right, corresponding to higher TMRE fluorescence. p values from Mann—WhitneyU test comparisons with the corresponding controls are shown under the treatment conditions. Data are fromn = 27–150 cells (see Table 1).