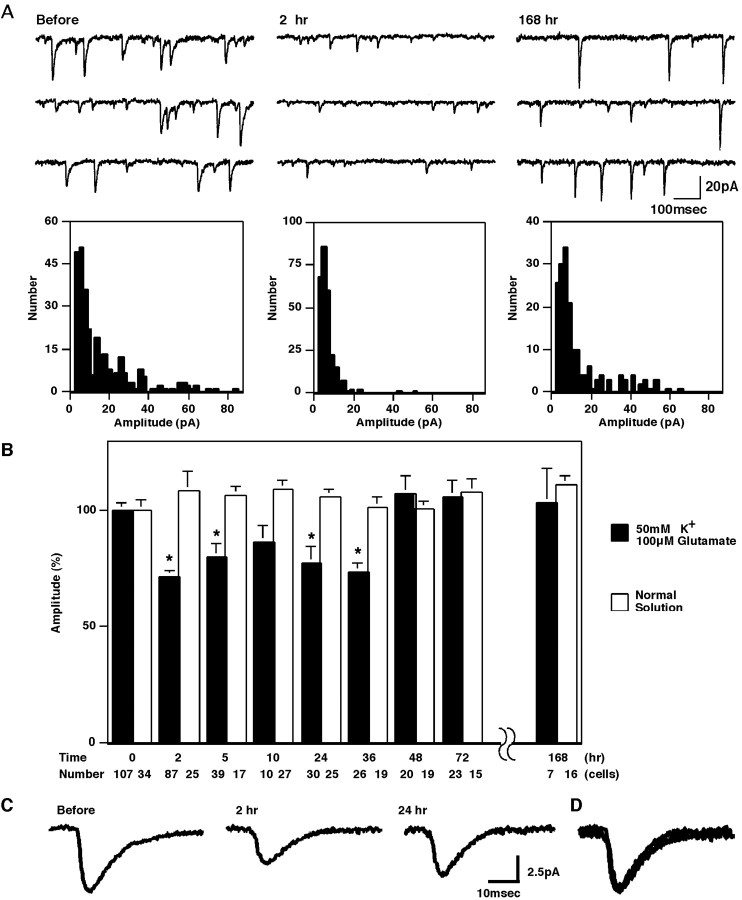
Fig. 1.
The mEPSCs in cultured Purkinje neurons and the DME. A, Representative traces and amplitude histograms of mEPSCs before and 2 and 168 hr after the conditioning treatment.B, Changes of mEPSC amplitudes by the 5 min conditioning treatment with 50 mm K+ and 100 μm glutamate. Mean amplitudes of mEPSCs after the conditioning treatment were compared with those before the conditioning (shown as 0 hr). The data presented were obtained between 1 hr before and 1 hr after the indicated time. *p < 0.01 indicates the data showing significant differences against the value before the conditioning. Results of the control treatment with the normal external saline are also presented. The number of recorded cells is shown at the bottom. C, Averaged traces of 20 mEPSCs before and 2 and 24 hr after the conditioning treatment.D, Three traces in C are scaled and superimposed.

