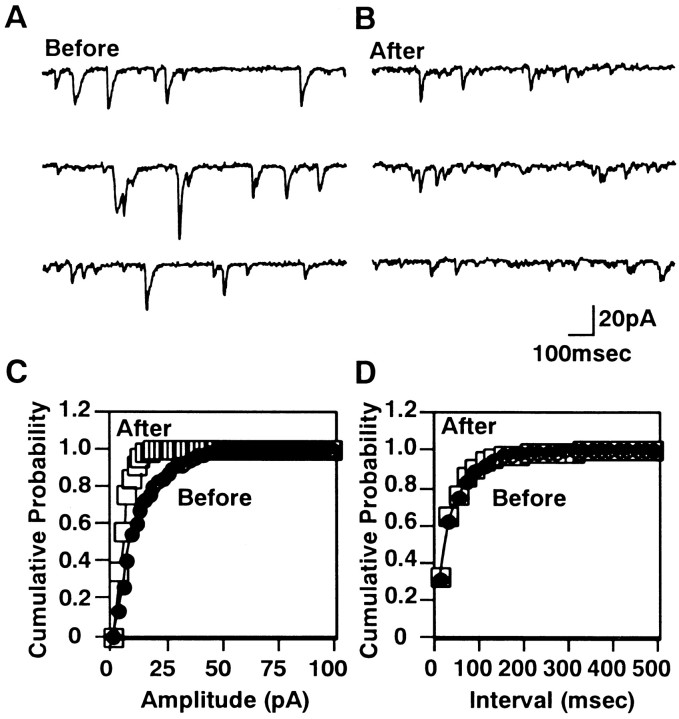
Fig. 2.
The mEPSCs from a single Purkinje neuron before and after the conditioning treatment. A, B, Representative traces before and 6 hr after the conditioning treatment, respectively. C, Cumulative probability of amplitudes before (filled circles) and after (open squares) the conditioning treatment. D, Cumulative probability of intervals before and after the conditioning.

