
Fig. 13.
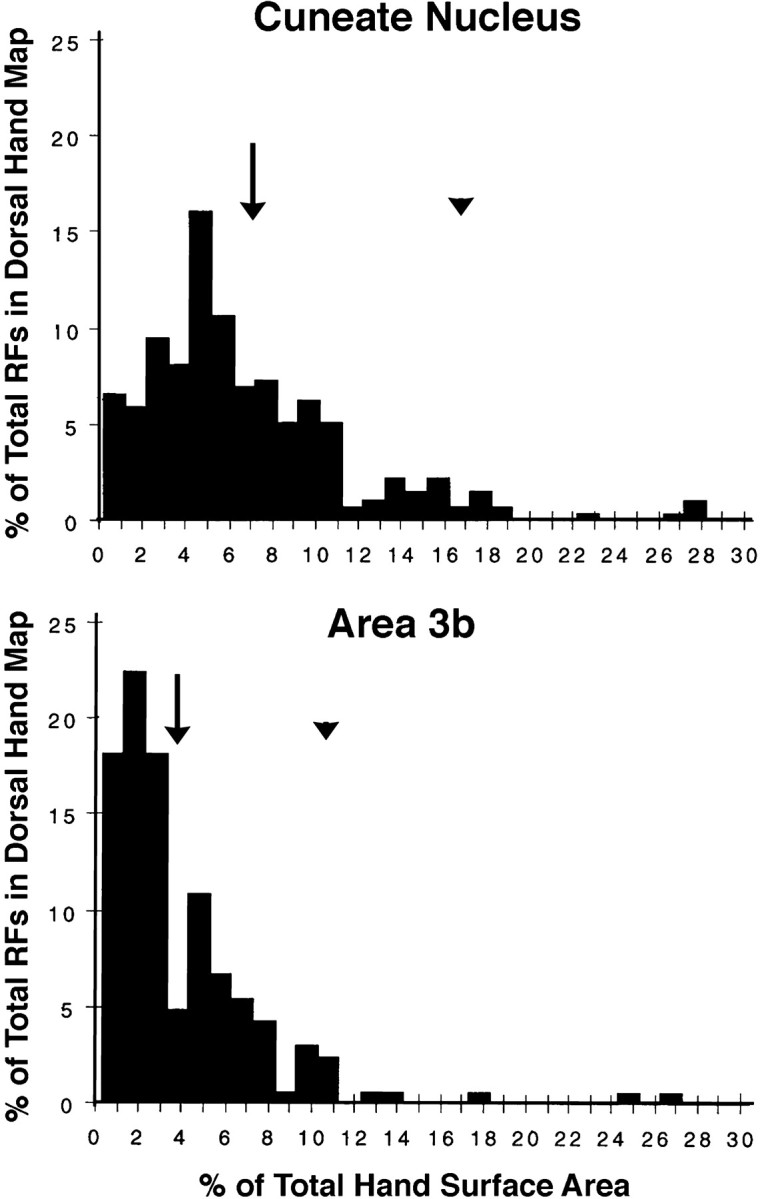
Histograms of the sizes of postinjury dorsal hand receptive fields in the CN (top) and area 3b (bottom). The distributions of CN and area 3b fields overlap; however, area 3b fields were smaller in terms of mean (arrows), mode (CN = 5%, area 3b = 2%), and upper 95% confidence (arrowheads) sizes. See Results for details.