Fig. 2.
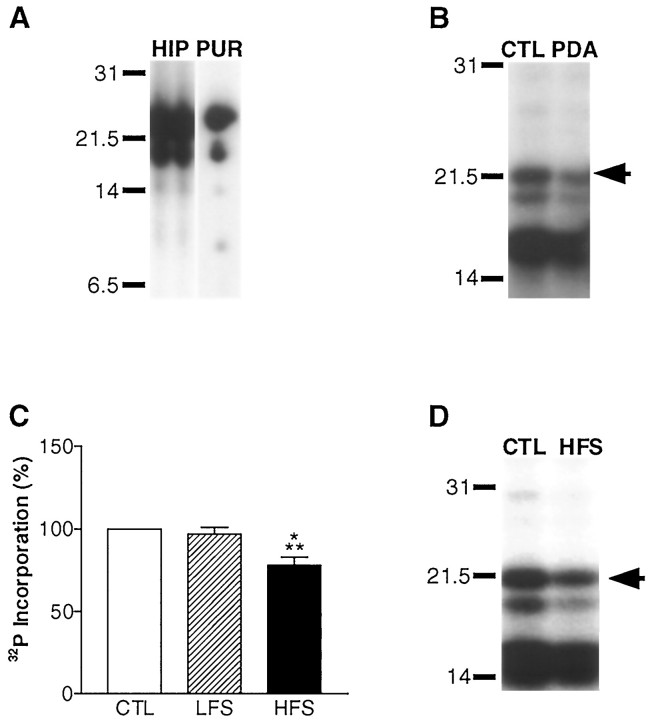
MBP phosphorylation during neuron–glia signaling in the alveus was assessed by back-phosphorylation (Atkins et al., 1997). A, MBP was identified on autoradiographs by comparing the phospho-peptide maps of MBP in the rat hippocampus (HIP) (shown in two lanes to facilitate comparison) with purified MBP (PUR) identified by amino acid sequencing (Atkins et al., 1997). Accordingly, if hippocampal slices were back-phosphorylated without the alveus, we observed a marked reduction in MBP amounts (data not shown). B, Activation of PKC by PDA applied for 5 min to hippocampal slices results in an observable increase in MBP phosphorylation in the back-phosphorylation assay. A representative autoradiograph is shown of a vehicle-treated (CTL, 0.01% DMSO) and a PDA-treated (PDA) hippocampal CA1 subregion subjected to back-phosphorylation. MBP is denoted by the arrow. In the back-phosphorylation assay, increases in phosphorylation are manifested as decreases in [32P]phosphate incorporation. C, Densitometric analysis of autoradiographs revealed no significant change in MBP phosphorylation after delivery of LFS throughout the duration of the experiment (75 min; n = 13). However, a significant increase in MBP phosphorylation was observed 45 min after tetanization of the alveus (78 ± 5% of control; n = 14;p < 0.001; ANOVA). Similar results were also observed when the slow synaptic transmission blockers MCPG and 2-hydroxysaclofen were included to block metabotropic glutamate and GABAB- mediated synaptic transmission (77 ± 13% of control; n = 3). There was no change in MBP amounts in HFS slices (116 ± 11% of control; n = 12) or LFS slices (113 ± 5% of control; n = 14).D, A representative autoradiograph is shown of a hippocampal slice that received HFS of the alveus (HFS) compared with a paired control slice (CTL) that were assayed by back-phosphorylation for changes in MBP phosphorylation in the CA1 subregion.

