
Fig. 2.
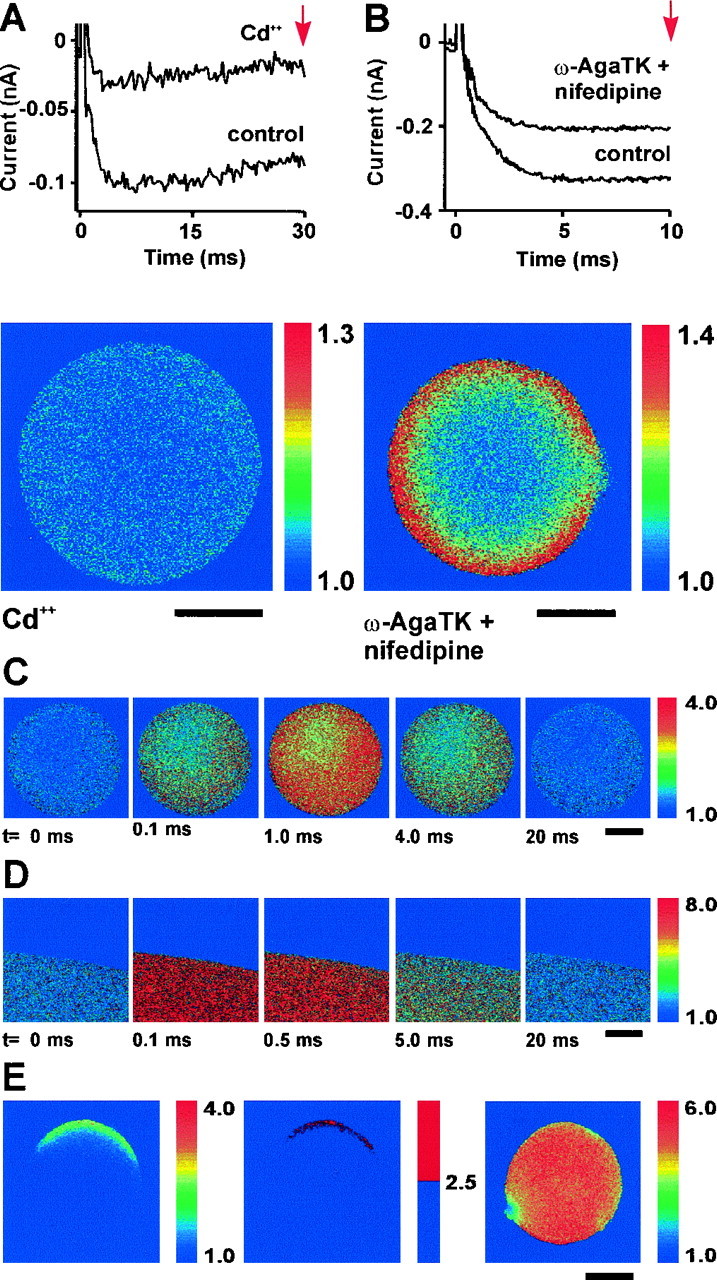
Imaging increases in Ca2+.A, Currents evoked by 30 msec steps from a holding potential of −80 to 0 mV before and after addition of 1 mmCd2+. The image below shows the ratio of control and depolarization fluorescence images after the addition of Cd2+. Note the complete block of the evoked Ca2+ elevation. B, Currents evoked by a 10 msec step from a holding potential of −80 to 0 mV before and 5 min after addition of 0.5 μm ω-agatoxin TK and 5 μm nifedipine. The ratio image below shows the ratio of control and depolarization fluorescence images after the addition of these antagonists. Note the sharp and homogeneous ring of elevated Ca2+. C, A series of images illustrating the fluorescence ratios in a terminal at different times after the release of Ca2+ from DM-nitrophen by a pulse of light from a UV laser. D, A similar experiment carried out in a droplet of aqueous solution surrounded by mineral oil.E, Ca2+ elevations evoked by electroporation of the terminal membrane. The ratio image on theleft shows elevations of Ca2+ ∼1 msec after electroporation; the adjacent image is a binary version. The image on the right shows the elevation of Ca2+ in the terminal several seconds later.