
Fig. 4.
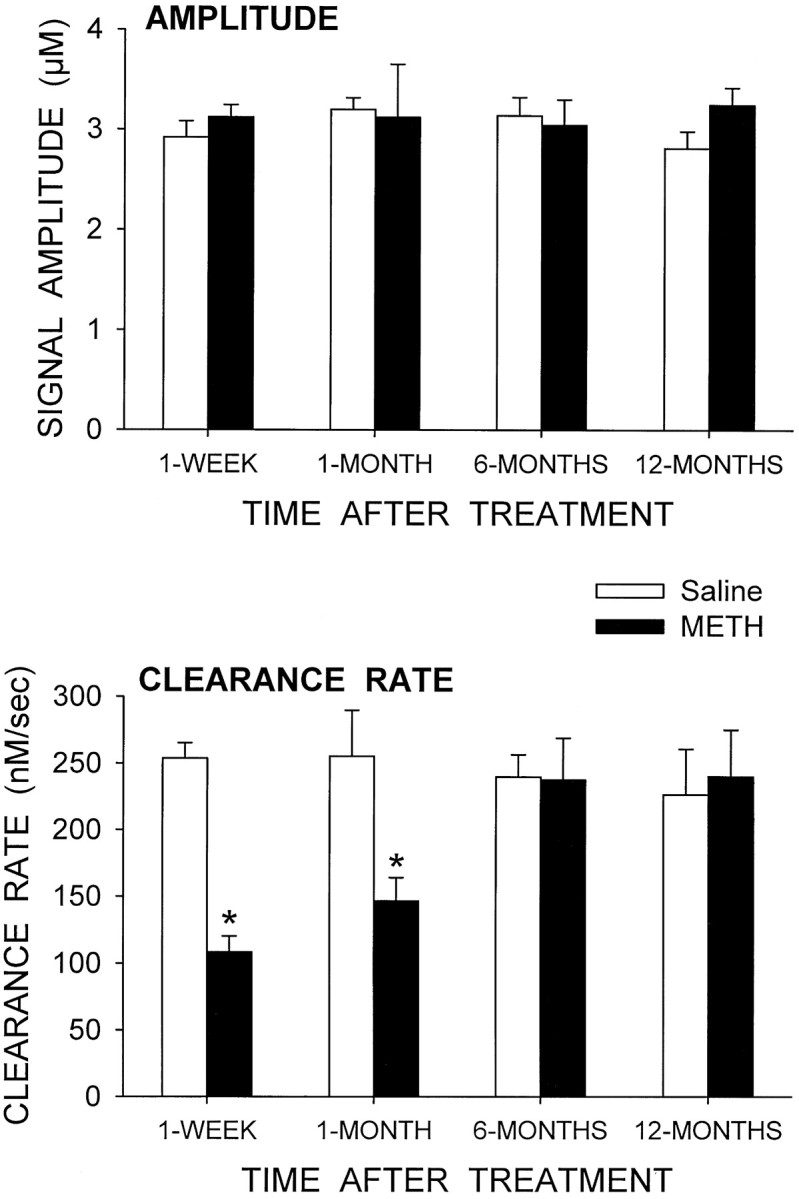
Clearance of exogenous DA in the striatum of saline- and METH-treated animals at four time points after treatment. DA was applied by pressure ejection into the striatum (3.5–6.0 mm below the surface of the brain), and its clearance was monitored electrochemically. The amount of DA applied at each site was adjusted to achieve a signal of ∼3 μm in amplitude (top graph). The corresponding clearance rates for the resulting signals are shown in the bottom graph. The data from all sites in each animal were averaged together to get a single mean value per animal. The values shown are mean ± SEM for four animals per group. *p < 0.05 versus saline group at same time (two-way ANOVA followed by Newman–Keuls post hoccomparisons).