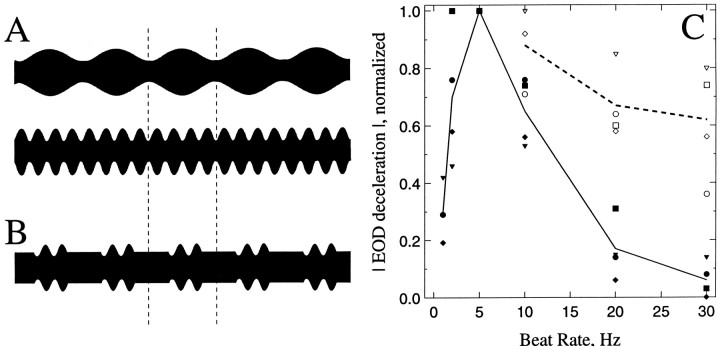
Fig. 2.
Behavioral evidence of short-term PSP depression.A, B, Oscillograms of continuous electrosensory stimuli with beat rates of 5 Hz (A; top) and 20 Hz (A; bottom) and of a discontinuous stimulus with a beat rate of 20 Hz that is gated at a rate of 5 Hz (B). Responses to the stimulus inB are the open symbolsabove 20 Hz in C. Dashed vertical lines represent the time for a full cycle at 5 Hz, 200 msec. C, Magnitude of EOD decelerations versus the beat rate for continuous (closed symbols) and discontinuous (open symbols) stimuli. The magnitude of responses was normalized for each fish to the maximum deceleration evoked from that fish. Each symbol type–-e.g., triangles,diamonds—represents data from an individual fish. Thesolid line is the mean response across fish to continuous stimuli. The dashed line is the mean for discontinuous stimuli.

