
Fig. 3.
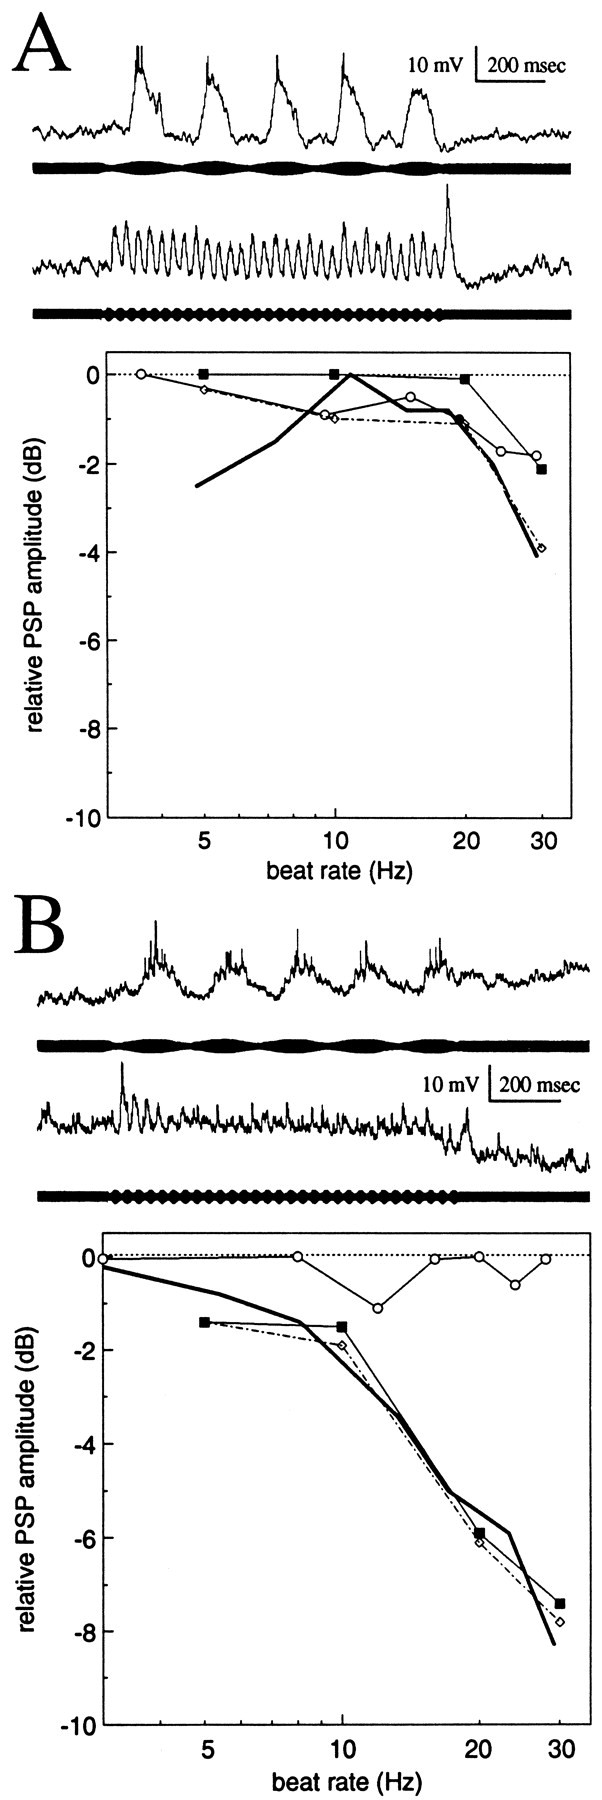
Responses of aspiny neurons to stimulus bursts.A, Neuron with little or no PSP depression.B, Neuron with strong PSP depression.Traces are responses to sensory bursts of 5 Hz (top trace) and 30 Hz (bottom trace) beat rates. The relative amplitudes of PSPs (in decibels) are plotted versus stimulation rate. Responses are to sensory scans (beat rate swept linearly from 2 to 30 Hz; thick lines), sinusoidal current injection (frequency swept linearly from 2 to 30 Hz;open circles), and stimulus bursts (closed squares). Values, in decibels, are normalized to the maximum PSP amplitude for each stimulus condition. For bursts, values are the differences in the magnitude of initial PSPs and last PSPs of each burst. These values therefore are a measurement of PSP depression. The dotted line with open diamondsindicates the combined effects of passive electrical filtering (as determined by injection of sinusoidal current) and PSP depression.