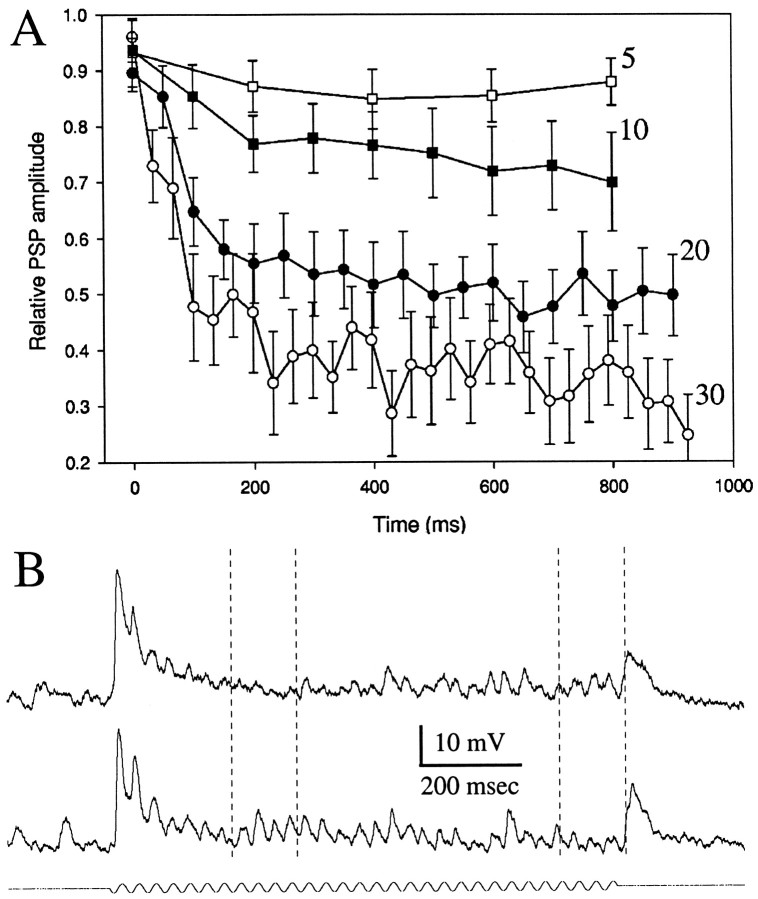
Fig. 6.
A, Time course and frequency dependence of PSP depression. PSPs were elicited by delivering sensory stimuli 1 sec in duration at 2 sec interstimulus intervals. Frequencies or beat rates of stimulation were 5 Hz (open squares), 10 Hz (closed squares), 20 Hz (closed circles), or 30 Hz (open circles). For each neuron, PSP amplitudes were normalized with respect to the largest (mean) PSP recorded for each stimulus condition. The time (x-axis) of occurrence of the first PSP in response to the stimulus was designated as the 0 point. Means and SEs are plotted. B, Intracellular recordings from an ampullary neuron. Top andbottom traces are responses to 30 Hz sinusoidal signals of ∼1 and 0.5 mV/cm, respectively.

