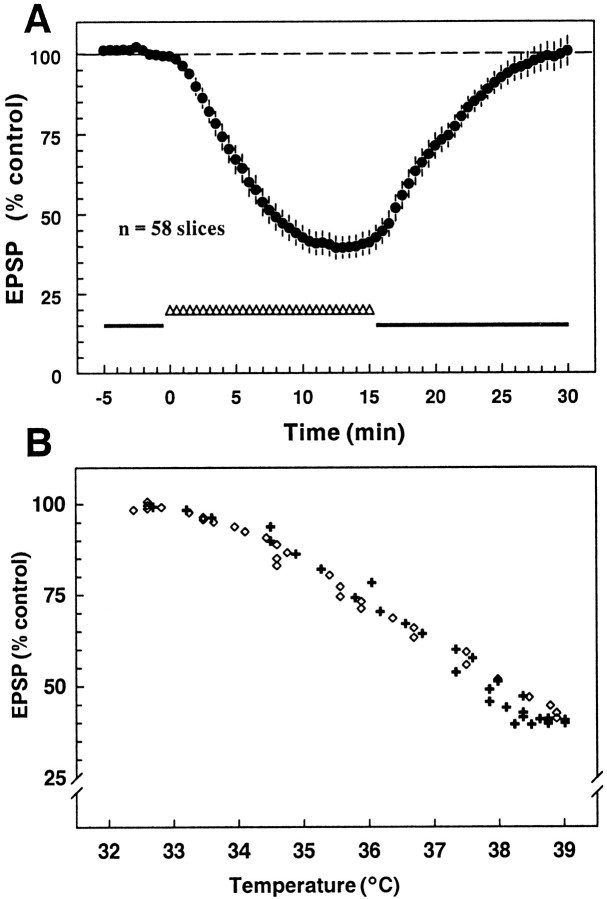
Fig. 2.
Effect of the 32.5→38.5°C protocol on fEPSP amplitude. A, Shown is the time course of the mean response of 58 slices to the increase in temperature; eachpoint is the mean ± SEM for 80% of the slices tested with this protocol. The additional 20% not included in the average did not show the characteristic sustained fEPSP decrease in response to the increased temperature (the fEPSP increased slightly, exhibited no change, or oscillated in amplitude during the increased temperature). On average, the fEPSP amplitude was reduced to 39.5 ± 3.5% of the control value by the temperature increase and recovered fully when the temperature change was reversed. B, Shown are the same data, but with the fEPSP plotted as a function of temperature instead of time. Responses elicited during the period when temperatures were increasing are indicated by a plus and during the decreasing phase by an open diamond. The relationship between temperature and response amplitude was nearly identical during both the temperature increase and decrease.

