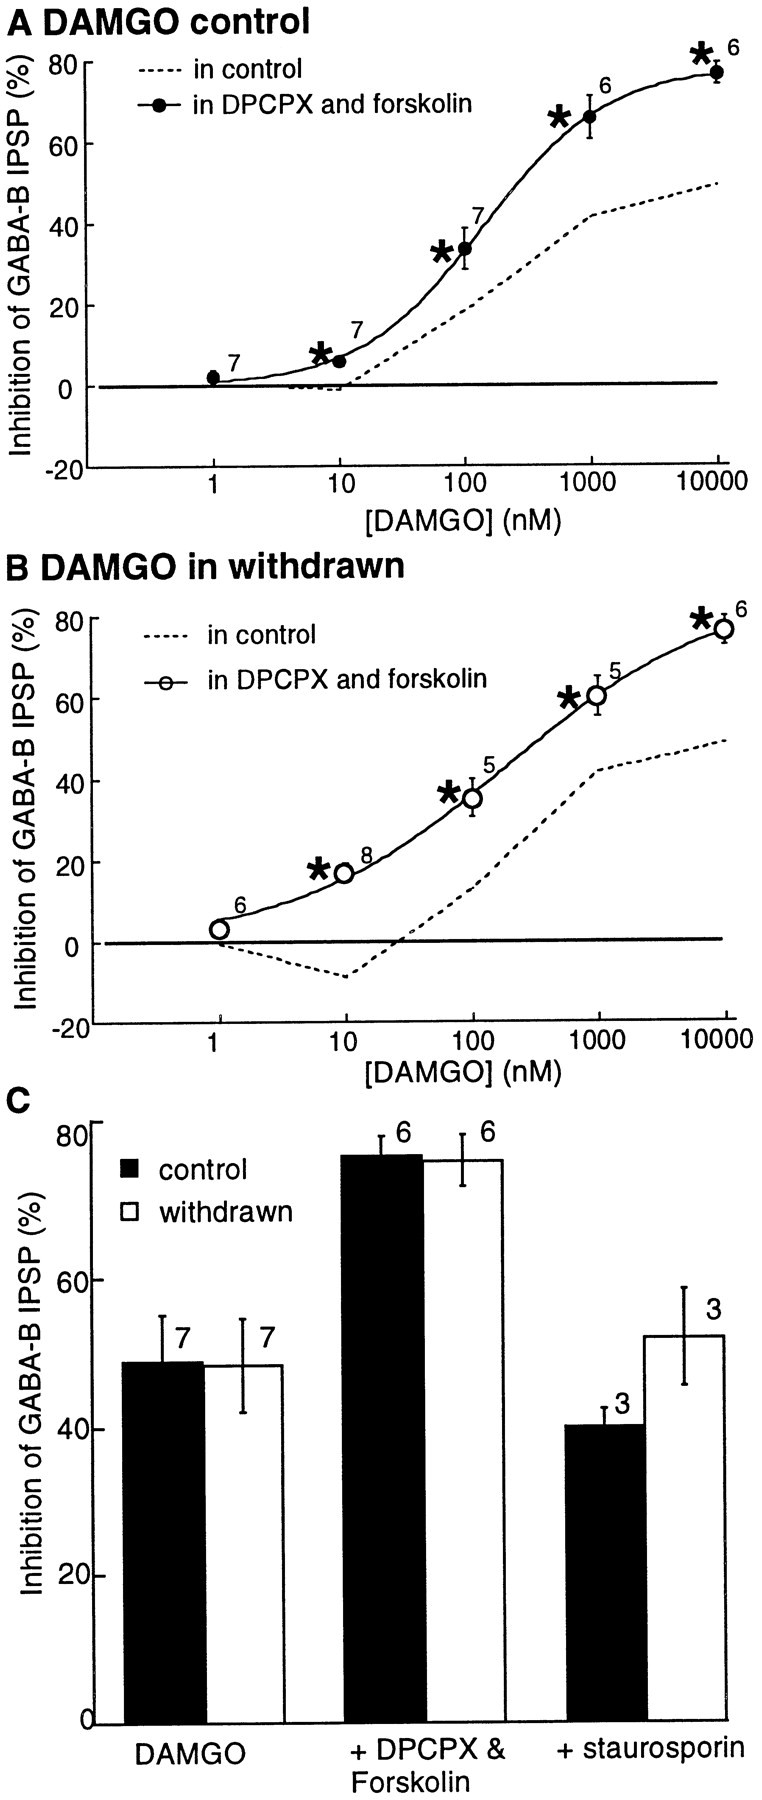
Fig. 8.

Forskolin increased the maximal inhibition caused by DAMGO in both control and withdrawn slices.A, B, Concentration–response curves to DAMGO are in the presence of both DPCPX and forskolin. Dashed lines indicate the concentration curves from control and withdrawn slices taken from Figure 2. In forskolin and DPCPX (unlike DPCPX alone) the concentration–response curves were similar in control and withdrawn slices. C indicates that the maximal DAMGO (10 μm) inhibition was increased in both tissues to the same extent by forskolin and DPCPX. Staurosporin (1 μm) decreased the augmented inhibition to a level similar to that found before treatment with forskolin and DPCPX.
