
Fig. 5.
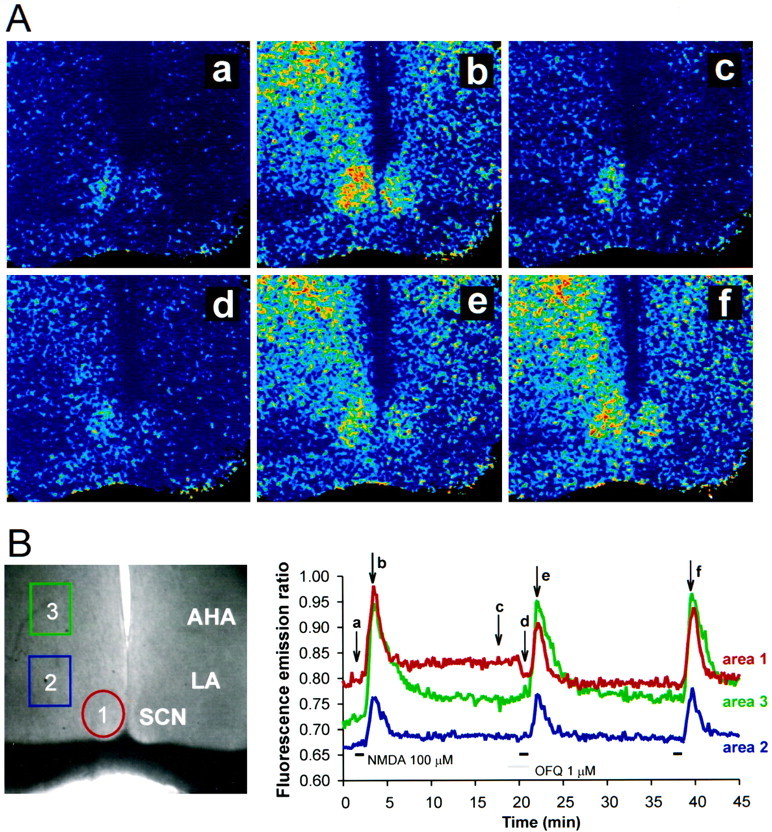
Effects of OFQ/N on intracellular Ca2+ and NMDA-activated increases in intracellular Ca2+. A, Pseudocolor ratio images of NMDA-evoked increases in intracellular Ca2+ concentration. The individual frames are control (a), NMDA (100 μm; b), washout of NMDA(c), application of OFQ/N (1 μm;d), NMDA (100 μm;e), and the control NMDA response (f). B, Normal illumination of an SCN slice shown with the regions of analysisoutlined. The graph represents a continuous plot of the data; the analyzed areas (areas 1–3) correspond to the outlined areas on the left inB. The images shown in Acorrespond to the letters on the graph inB. The images are taken once each 10 sec.Horizontal bars on the graph indicateNMDA and OFQ/N application. AHA, Anterior hypothalamus; LA, lateral anterior hypothalamus;OFQ, orphanin-FQ/nociceptin; SCN, suprachiasmatic nucleus.